Native/Alaskan vs Icelander In Labor Force | Age 20-24
COMPARE
Native/Alaskan
Icelander
In Labor Force | Age 20-24
In Labor Force | Age 20-24 Comparison
Natives/Alaskans
Icelanders
72.4%
IN LABOR FORCE | AGE 20-24
0.0/ 100
METRIC RATING
302nd/ 347
METRIC RANK
76.9%
IN LABOR FORCE | AGE 20-24
99.9/ 100
METRIC RATING
66th/ 347
METRIC RANK
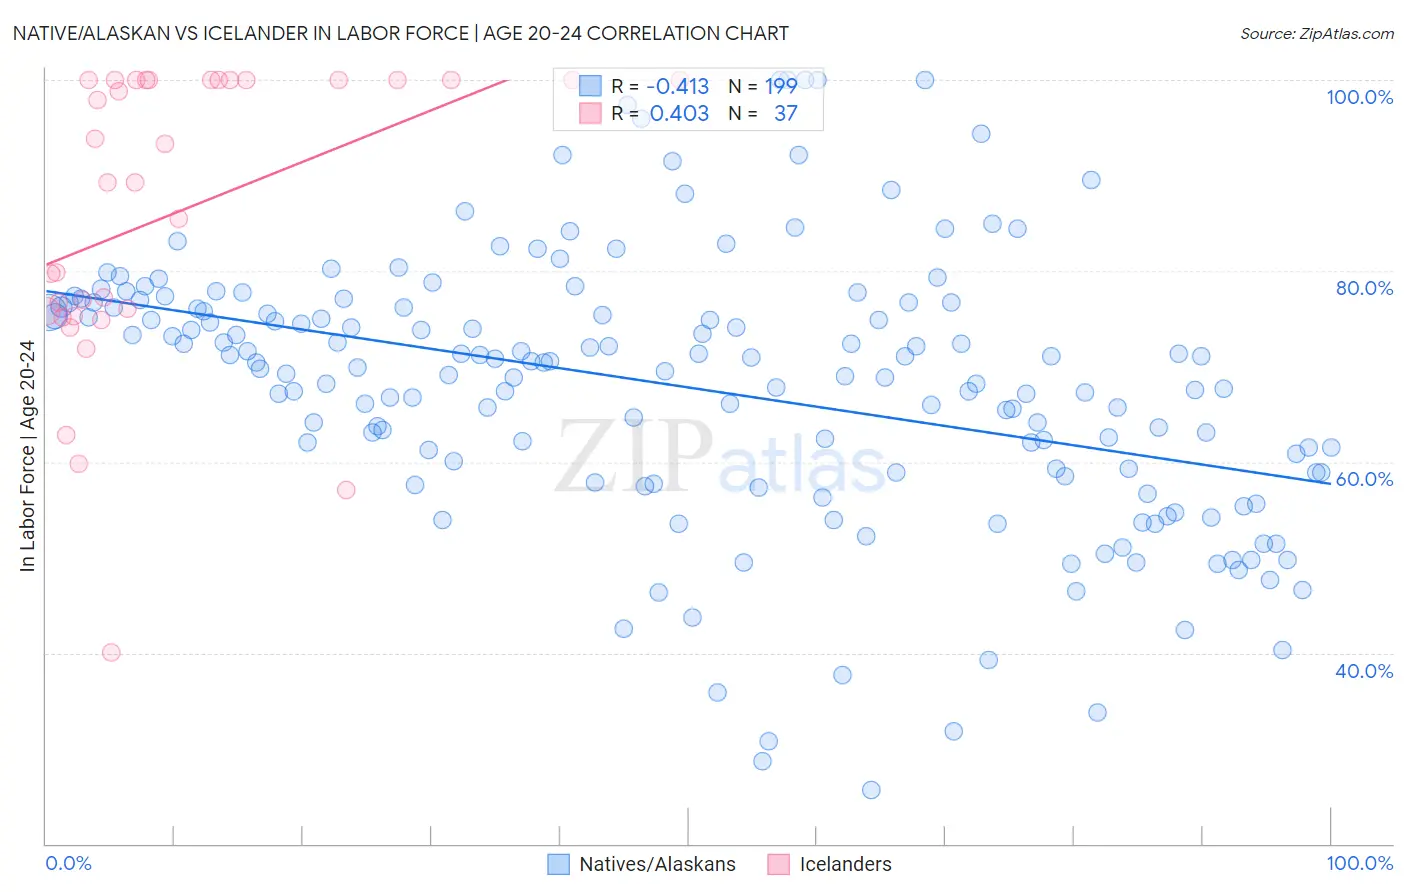
Native/Alaskan vs Icelander In Labor Force | Age 20-24 Correlation Chart
The statistical analysis conducted on geographies consisting of 512,418,491 people shows a moderate negative correlation between the proportion of Natives/Alaskans and labor force participation rate among population between the ages 20 and 24 in the United States with a correlation coefficient (R) of -0.413 and weighted average of 72.4%. Similarly, the statistical analysis conducted on geographies consisting of 159,597,296 people shows a moderate positive correlation between the proportion of Icelanders and labor force participation rate among population between the ages 20 and 24 in the United States with a correlation coefficient (R) of 0.403 and weighted average of 76.9%, a difference of 6.1%.
In Labor Force | Age 20-24 Correlation Summary
| Measurement | Native/Alaskan | Icelander |
| Minimum | 25.7% | 40.0% |
| Maximum | 100.0% | 100.0% |
| Range | 74.3% | 60.0% |
| Mean | 67.8% | 86.0% |
| Median | 69.8% | 89.3% |
| Interquartile 25% (IQ1) | 58.9% | 75.6% |
| Interquartile 75% (IQ3) | 76.2% | 100.0% |
| Interquartile Range (IQR) | 17.3% | 24.4% |
| Standard Deviation (Sample) | 14.2% | 15.4% |
| Standard Deviation (Population) | 14.2% | 15.2% |
Similar Demographics by In Labor Force | Age 20-24
Demographics Similar to Natives/Alaskans by In Labor Force | Age 20-24
In terms of in labor force | age 20-24, the demographic groups most similar to Natives/Alaskans are Ecuadorian (72.4%, a difference of 0.010%), Immigrants from West Indies (72.4%, a difference of 0.020%), Immigrants from Singapore (72.4%, a difference of 0.050%), Immigrants from Jamaica (72.4%, a difference of 0.070%), and Cuban (72.5%, a difference of 0.090%).
| Demographics | Rating | Rank | In Labor Force | Age 20-24 |
| Okinawans | 0.0 /100 | #295 | Tragic 72.7% |
| Jamaicans | 0.0 /100 | #296 | Tragic 72.7% |
| Central American Indians | 0.0 /100 | #297 | Tragic 72.7% |
| Israelis | 0.0 /100 | #298 | Tragic 72.6% |
| Iranians | 0.0 /100 | #299 | Tragic 72.6% |
| Armenians | 0.0 /100 | #300 | Tragic 72.5% |
| Cubans | 0.0 /100 | #301 | Tragic 72.5% |
| Natives/Alaskans | 0.0 /100 | #302 | Tragic 72.4% |
| Ecuadorians | 0.0 /100 | #303 | Tragic 72.4% |
| Immigrants | West Indies | 0.0 /100 | #304 | Tragic 72.4% |
| Immigrants | Singapore | 0.0 /100 | #305 | Tragic 72.4% |
| Immigrants | Jamaica | 0.0 /100 | #306 | Tragic 72.4% |
| Immigrants | Ecuador | 0.0 /100 | #307 | Tragic 72.3% |
| Soviet Union | 0.0 /100 | #308 | Tragic 72.3% |
| Tsimshian | 0.0 /100 | #309 | Tragic 72.3% |
Demographics Similar to Icelanders by In Labor Force | Age 20-24
In terms of in labor force | age 20-24, the demographic groups most similar to Icelanders are Slavic (76.9%, a difference of 0.010%), Crow (76.9%, a difference of 0.020%), French American Indian (76.8%, a difference of 0.040%), Immigrants from Sudan (76.8%, a difference of 0.060%), and White/Caucasian (76.9%, a difference of 0.070%).
| Demographics | Rating | Rank | In Labor Force | Age 20-24 |
| Scotch-Irish | 99.9 /100 | #59 | Exceptional 77.0% |
| Kenyans | 99.9 /100 | #60 | Exceptional 77.0% |
| Immigrants | Eritrea | 99.9 /100 | #61 | Exceptional 77.0% |
| Immigrants | Kenya | 99.9 /100 | #62 | Exceptional 77.0% |
| Lithuanians | 99.9 /100 | #63 | Exceptional 77.0% |
| Whites/Caucasians | 99.9 /100 | #64 | Exceptional 76.9% |
| Crow | 99.9 /100 | #65 | Exceptional 76.9% |
| Icelanders | 99.9 /100 | #66 | Exceptional 76.9% |
| Slavs | 99.9 /100 | #67 | Exceptional 76.9% |
| French American Indians | 99.8 /100 | #68 | Exceptional 76.8% |
| Immigrants | Sudan | 99.8 /100 | #69 | Exceptional 76.8% |
| Ottawa | 99.8 /100 | #70 | Exceptional 76.8% |
| Northern Europeans | 99.8 /100 | #71 | Exceptional 76.8% |
| Guamanians/Chamorros | 99.8 /100 | #72 | Exceptional 76.7% |
| British | 99.8 /100 | #73 | Exceptional 76.7% |