Cuban vs Icelander Births to Unmarried Women
COMPARE
Cuban
Icelander
Births to Unmarried Women
Births to Unmarried Women Comparison
Cubans
Icelanders
39.4%
BIRTHS TO UNMARRIED WOMEN
0.0/ 100
METRIC RATING
309th/ 347
METRIC RANK
30.3%
BIRTHS TO UNMARRIED WOMEN
86.0/ 100
METRIC RATING
128th/ 347
METRIC RANK
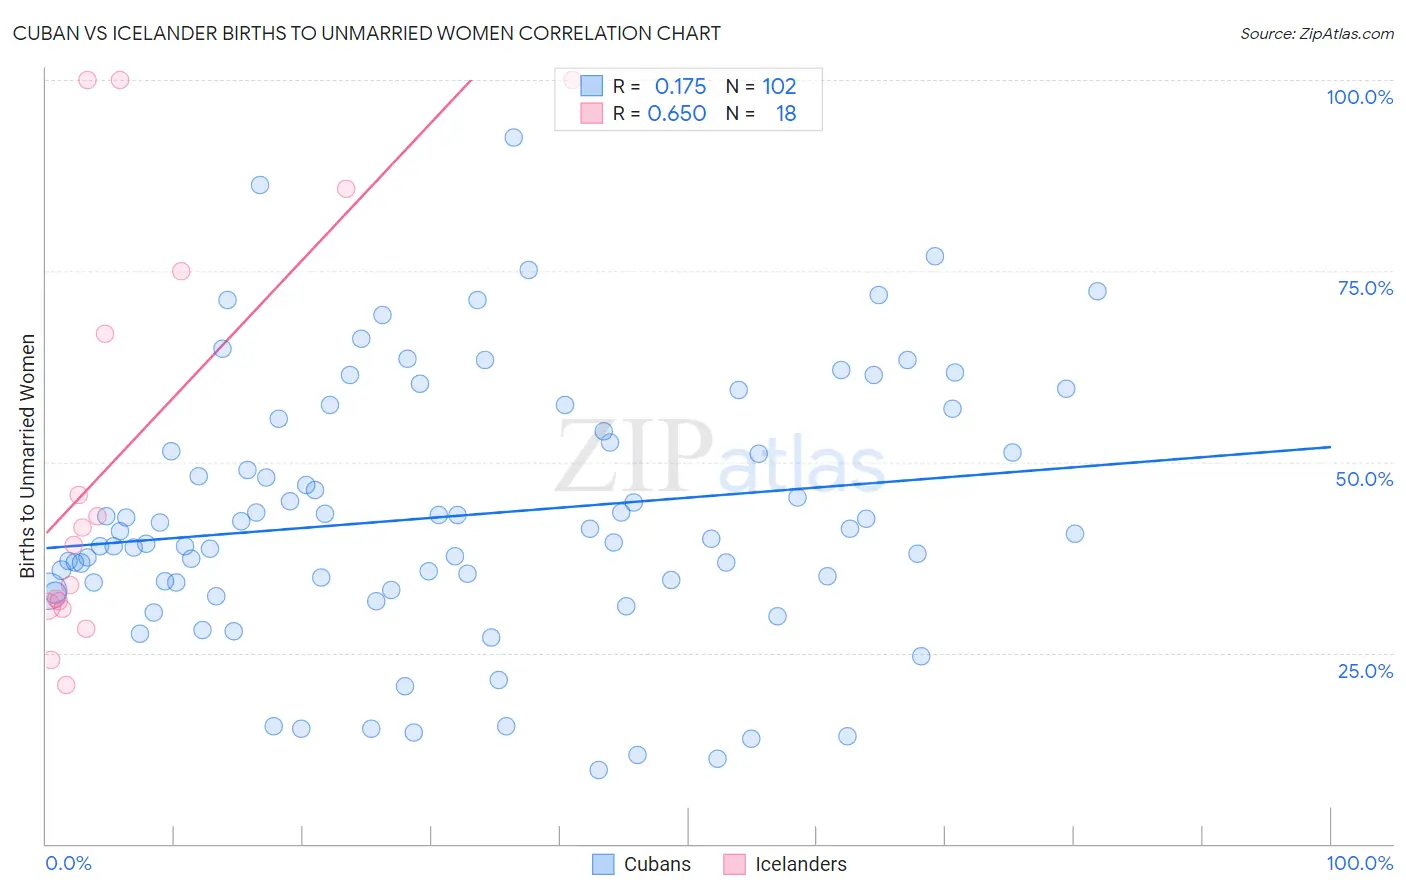
Cuban vs Icelander Births to Unmarried Women Correlation Chart
The statistical analysis conducted on geographies consisting of 417,413,482 people shows a poor positive correlation between the proportion of Cubans and percentage of births to unmarried women in the United States with a correlation coefficient (R) of 0.175 and weighted average of 39.4%. Similarly, the statistical analysis conducted on geographies consisting of 153,143,056 people shows a significant positive correlation between the proportion of Icelanders and percentage of births to unmarried women in the United States with a correlation coefficient (R) of 0.650 and weighted average of 30.3%, a difference of 29.9%.
Births to Unmarried Women Correlation Summary
| Measurement | Cuban | Icelander |
| Minimum | 9.6% | 20.8% |
| Maximum | 92.5% | 100.0% |
| Range | 82.9% | 79.2% |
| Mean | 42.9% | 51.6% |
| Median | 40.7% | 40.2% |
| Interquartile 25% (IQ1) | 34.2% | 31.0% |
| Interquartile 75% (IQ3) | 54.0% | 75.0% |
| Interquartile Range (IQR) | 19.8% | 44.0% |
| Standard Deviation (Sample) | 17.0% | 28.2% |
| Standard Deviation (Population) | 16.9% | 27.4% |
Similar Demographics by Births to Unmarried Women
Demographics Similar to Cubans by Births to Unmarried Women
In terms of births to unmarried women, the demographic groups most similar to Cubans are Aleut (39.3%, a difference of 0.12%), Immigrants from Honduras (39.3%, a difference of 0.21%), Immigrants from Dominica (39.5%, a difference of 0.22%), Immigrants from the Azores (39.6%, a difference of 0.46%), and U.S. Virgin Islander (39.6%, a difference of 0.48%).
| Demographics | Rating | Rank | Births to Unmarried Women |
| Hondurans | 0.0 /100 | #302 | Tragic 38.7% |
| Immigrants | Jamaica | 0.0 /100 | #303 | Tragic 38.8% |
| Yaqui | 0.0 /100 | #304 | Tragic 38.8% |
| Immigrants | Haiti | 0.0 /100 | #305 | Tragic 38.9% |
| Central American Indians | 0.0 /100 | #306 | Tragic 39.0% |
| Immigrants | Honduras | 0.0 /100 | #307 | Tragic 39.3% |
| Aleuts | 0.0 /100 | #308 | Tragic 39.3% |
| Cubans | 0.0 /100 | #309 | Tragic 39.4% |
| Immigrants | Dominica | 0.0 /100 | #310 | Tragic 39.5% |
| Immigrants | Azores | 0.0 /100 | #311 | Tragic 39.6% |
| U.S. Virgin Islanders | 0.0 /100 | #312 | Tragic 39.6% |
| Africans | 0.0 /100 | #313 | Tragic 39.7% |
| Immigrants | Caribbean | 0.0 /100 | #314 | Tragic 39.8% |
| Dominicans | 0.0 /100 | #315 | Tragic 39.8% |
| Apache | 0.0 /100 | #316 | Tragic 39.9% |
Demographics Similar to Icelanders by Births to Unmarried Women
In terms of births to unmarried women, the demographic groups most similar to Icelanders are Immigrants from Spain (30.3%, a difference of 0.040%), Immigrants from Bosnia and Herzegovina (30.3%, a difference of 0.050%), Immigrants from Zimbabwe (30.3%, a difference of 0.060%), New Zealander (30.3%, a difference of 0.10%), and Immigrants from Morocco (30.4%, a difference of 0.15%).
| Demographics | Rating | Rank | Births to Unmarried Women |
| Koreans | 88.9 /100 | #121 | Excellent 30.1% |
| Immigrants | Argentina | 88.7 /100 | #122 | Excellent 30.1% |
| Syrians | 88.2 /100 | #123 | Excellent 30.2% |
| Croatians | 88.0 /100 | #124 | Excellent 30.2% |
| Vietnamese | 87.7 /100 | #125 | Excellent 30.2% |
| Europeans | 87.2 /100 | #126 | Excellent 30.2% |
| Chinese | 87.1 /100 | #127 | Excellent 30.2% |
| Icelanders | 86.0 /100 | #128 | Excellent 30.3% |
| Immigrants | Spain | 85.8 /100 | #129 | Excellent 30.3% |
| Immigrants | Bosnia and Herzegovina | 85.7 /100 | #130 | Excellent 30.3% |
| Immigrants | Zimbabwe | 85.7 /100 | #131 | Excellent 30.3% |
| New Zealanders | 85.5 /100 | #132 | Excellent 30.3% |
| Immigrants | Morocco | 85.2 /100 | #133 | Excellent 30.4% |
| Immigrants | South Eastern Asia | 85.2 /100 | #134 | Excellent 30.4% |
| Brazilians | 84.8 /100 | #135 | Excellent 30.4% |