Native/Alaskan vs Immigrants from Guyana Births to Unmarried Women
COMPARE
Native/Alaskan
Immigrants from Guyana
Births to Unmarried Women
Births to Unmarried Women Comparison
Natives/Alaskans
Immigrants from Guyana
43.0%
BIRTHS TO UNMARRIED WOMEN
0.0/ 100
METRIC RATING
331st/ 347
METRIC RANK
35.0%
BIRTHS TO UNMARRIED WOMEN
1.2/ 100
METRIC RATING
241st/ 347
METRIC RANK
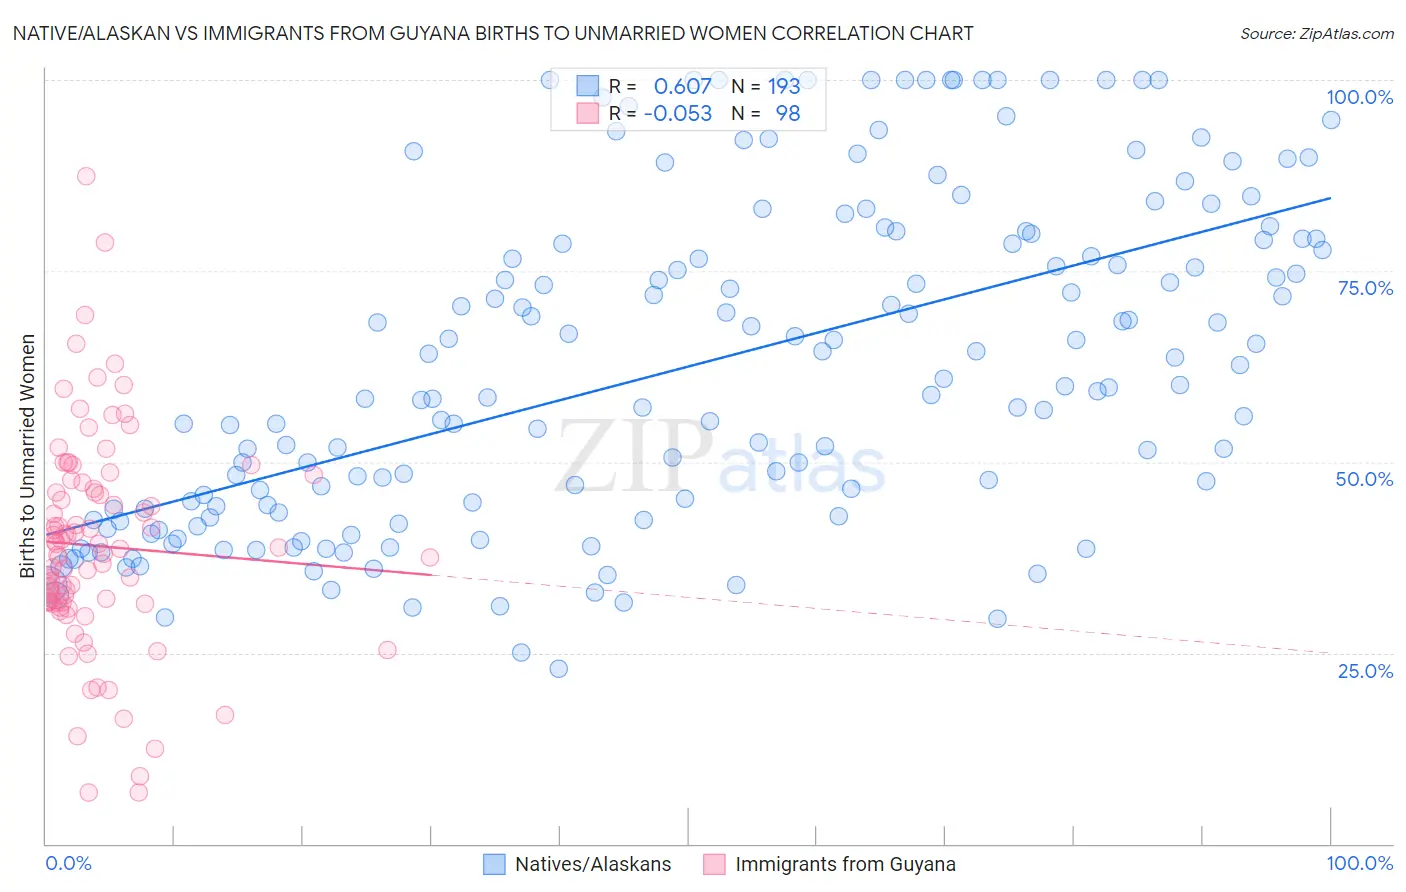
Native/Alaskan vs Immigrants from Guyana Births to Unmarried Women Correlation Chart
The statistical analysis conducted on geographies consisting of 471,404,476 people shows a significant positive correlation between the proportion of Natives/Alaskans and percentage of births to unmarried women in the United States with a correlation coefficient (R) of 0.607 and weighted average of 43.0%. Similarly, the statistical analysis conducted on geographies consisting of 177,005,491 people shows a slight negative correlation between the proportion of Immigrants from Guyana and percentage of births to unmarried women in the United States with a correlation coefficient (R) of -0.053 and weighted average of 35.0%, a difference of 23.0%.
Births to Unmarried Women Correlation Summary
| Measurement | Native/Alaskan | Immigrants from Guyana |
| Minimum | 22.9% | 6.7% |
| Maximum | 100.0% | 87.4% |
| Range | 77.1% | 80.7% |
| Mean | 62.5% | 39.0% |
| Median | 59.8% | 38.4% |
| Interquartile 25% (IQ1) | 43.2% | 31.6% |
| Interquartile 75% (IQ3) | 79.1% | 46.5% |
| Interquartile Range (IQR) | 35.9% | 14.9% |
| Standard Deviation (Sample) | 21.3% | 14.0% |
| Standard Deviation (Population) | 21.3% | 14.0% |
Similar Demographics by Births to Unmarried Women
Demographics Similar to Natives/Alaskans by Births to Unmarried Women
In terms of births to unmarried women, the demographic groups most similar to Natives/Alaskans are Kiowa (43.1%, a difference of 0.35%), Chippewa (42.6%, a difference of 0.83%), Paiute (42.5%, a difference of 1.2%), Immigrants from Cabo Verde (42.2%, a difference of 1.8%), and Tsimshian (42.2%, a difference of 2.0%).
| Demographics | Rating | Rank | Births to Unmarried Women |
| Cape Verdeans | 0.0 /100 | #324 | Tragic 41.3% |
| Cheyenne | 0.0 /100 | #325 | Tragic 41.3% |
| Immigrants | Cuba | 0.0 /100 | #326 | Tragic 41.5% |
| Tsimshian | 0.0 /100 | #327 | Tragic 42.2% |
| Immigrants | Cabo Verde | 0.0 /100 | #328 | Tragic 42.2% |
| Paiute | 0.0 /100 | #329 | Tragic 42.5% |
| Chippewa | 0.0 /100 | #330 | Tragic 42.6% |
| Natives/Alaskans | 0.0 /100 | #331 | Tragic 43.0% |
| Kiowa | 0.0 /100 | #332 | Tragic 43.1% |
| Blacks/African Americans | 0.0 /100 | #333 | Tragic 44.3% |
| Yuman | 0.0 /100 | #334 | Tragic 44.4% |
| Colville | 0.0 /100 | #335 | Tragic 45.3% |
| Puerto Ricans | 0.0 /100 | #336 | Tragic 45.7% |
| Houma | 0.0 /100 | #337 | Tragic 46.6% |
| Arapaho | 0.0 /100 | #338 | Tragic 47.1% |
Demographics Similar to Immigrants from Guyana by Births to Unmarried Women
In terms of births to unmarried women, the demographic groups most similar to Immigrants from Guyana are Immigrants from Middle Africa (34.9%, a difference of 0.030%), Indonesian (35.0%, a difference of 0.10%), Sierra Leonean (34.9%, a difference of 0.28%), Immigrants from Cambodia (34.8%, a difference of 0.51%), and Marshallese (34.8%, a difference of 0.57%).
| Demographics | Rating | Rank | Births to Unmarried Women |
| Immigrants | Zaire | 2.3 /100 | #234 | Tragic 34.5% |
| Immigrants | Ghana | 2.2 /100 | #235 | Tragic 34.5% |
| Immigrants | Cameroon | 1.6 /100 | #236 | Tragic 34.7% |
| Marshallese | 1.6 /100 | #237 | Tragic 34.8% |
| Immigrants | Cambodia | 1.6 /100 | #238 | Tragic 34.8% |
| Sierra Leoneans | 1.4 /100 | #239 | Tragic 34.9% |
| Immigrants | Middle Africa | 1.2 /100 | #240 | Tragic 34.9% |
| Immigrants | Guyana | 1.2 /100 | #241 | Tragic 35.0% |
| Indonesians | 1.2 /100 | #242 | Tragic 35.0% |
| Japanese | 0.9 /100 | #243 | Tragic 35.2% |
| Guyanese | 0.9 /100 | #244 | Tragic 35.2% |
| Shoshone | 0.8 /100 | #245 | Tragic 35.3% |
| Nigerians | 0.7 /100 | #246 | Tragic 35.3% |
| Immigrants | Nigeria | 0.7 /100 | #247 | Tragic 35.4% |
| Immigrants | Nonimmigrants | 0.6 /100 | #248 | Tragic 35.5% |