Native/Alaskan vs Laotian Births to Unmarried Women
COMPARE
Native/Alaskan
Laotian
Births to Unmarried Women
Births to Unmarried Women Comparison
Natives/Alaskans
Laotians
43.0%
BIRTHS TO UNMARRIED WOMEN
0.0/ 100
METRIC RATING
331st/ 347
METRIC RANK
28.5%
BIRTHS TO UNMARRIED WOMEN
98.6/ 100
METRIC RATING
70th/ 347
METRIC RANK
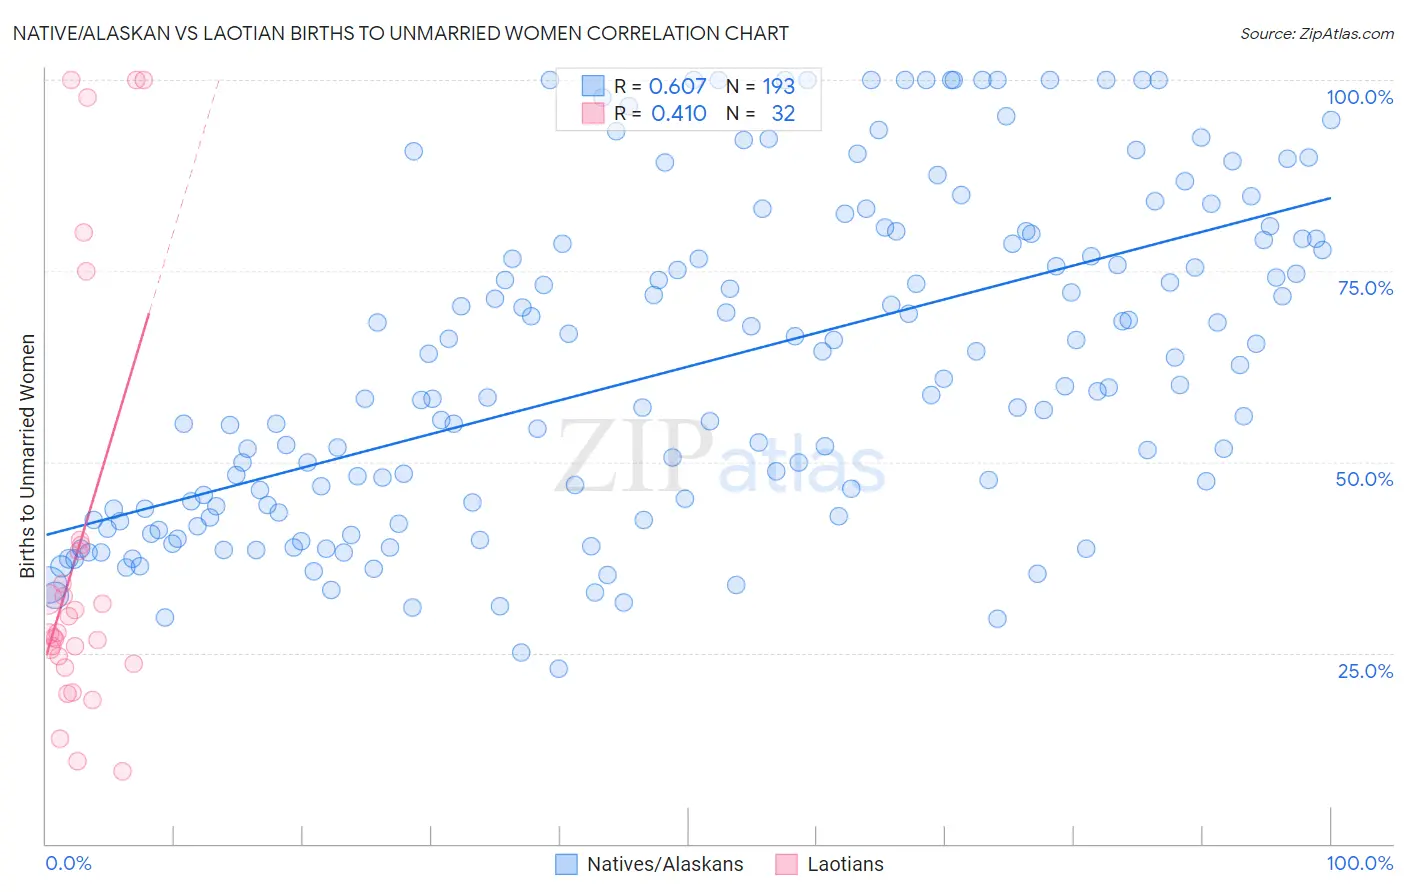
Native/Alaskan vs Laotian Births to Unmarried Women Correlation Chart
The statistical analysis conducted on geographies consisting of 471,404,476 people shows a significant positive correlation between the proportion of Natives/Alaskans and percentage of births to unmarried women in the United States with a correlation coefficient (R) of 0.607 and weighted average of 43.0%. Similarly, the statistical analysis conducted on geographies consisting of 215,268,229 people shows a moderate positive correlation between the proportion of Laotians and percentage of births to unmarried women in the United States with a correlation coefficient (R) of 0.410 and weighted average of 28.5%, a difference of 51.0%.
Births to Unmarried Women Correlation Summary
| Measurement | Native/Alaskan | Laotian |
| Minimum | 22.9% | 9.5% |
| Maximum | 100.0% | 100.0% |
| Range | 77.1% | 90.5% |
| Mean | 62.5% | 38.6% |
| Median | 59.8% | 27.5% |
| Interquartile 25% (IQ1) | 43.2% | 24.0% |
| Interquartile 75% (IQ3) | 79.1% | 38.7% |
| Interquartile Range (IQR) | 35.9% | 14.7% |
| Standard Deviation (Sample) | 21.3% | 27.4% |
| Standard Deviation (Population) | 21.3% | 27.0% |
Similar Demographics by Births to Unmarried Women
Demographics Similar to Natives/Alaskans by Births to Unmarried Women
In terms of births to unmarried women, the demographic groups most similar to Natives/Alaskans are Kiowa (43.1%, a difference of 0.35%), Chippewa (42.6%, a difference of 0.83%), Paiute (42.5%, a difference of 1.2%), Immigrants from Cabo Verde (42.2%, a difference of 1.8%), and Tsimshian (42.2%, a difference of 2.0%).
| Demographics | Rating | Rank | Births to Unmarried Women |
| Cape Verdeans | 0.0 /100 | #324 | Tragic 41.3% |
| Cheyenne | 0.0 /100 | #325 | Tragic 41.3% |
| Immigrants | Cuba | 0.0 /100 | #326 | Tragic 41.5% |
| Tsimshian | 0.0 /100 | #327 | Tragic 42.2% |
| Immigrants | Cabo Verde | 0.0 /100 | #328 | Tragic 42.2% |
| Paiute | 0.0 /100 | #329 | Tragic 42.5% |
| Chippewa | 0.0 /100 | #330 | Tragic 42.6% |
| Natives/Alaskans | 0.0 /100 | #331 | Tragic 43.0% |
| Kiowa | 0.0 /100 | #332 | Tragic 43.1% |
| Blacks/African Americans | 0.0 /100 | #333 | Tragic 44.3% |
| Yuman | 0.0 /100 | #334 | Tragic 44.4% |
| Colville | 0.0 /100 | #335 | Tragic 45.3% |
| Puerto Ricans | 0.0 /100 | #336 | Tragic 45.7% |
| Houma | 0.0 /100 | #337 | Tragic 46.6% |
| Arapaho | 0.0 /100 | #338 | Tragic 47.1% |
Demographics Similar to Laotians by Births to Unmarried Women
In terms of births to unmarried women, the demographic groups most similar to Laotians are Bolivian (28.5%, a difference of 0.060%), Immigrants from Europe (28.4%, a difference of 0.10%), Palestinian (28.4%, a difference of 0.15%), Jordanian (28.5%, a difference of 0.18%), and Immigrants from Sweden (28.5%, a difference of 0.23%).
| Demographics | Rating | Rank | Births to Unmarried Women |
| Immigrants | Serbia | 98.9 /100 | #63 | Exceptional 28.3% |
| Tongans | 98.8 /100 | #64 | Exceptional 28.4% |
| Immigrants | Czechoslovakia | 98.8 /100 | #65 | Exceptional 28.4% |
| Immigrants | Egypt | 98.8 /100 | #66 | Exceptional 28.4% |
| Palestinians | 98.7 /100 | #67 | Exceptional 28.4% |
| Immigrants | Europe | 98.7 /100 | #68 | Exceptional 28.4% |
| Bolivians | 98.7 /100 | #69 | Exceptional 28.5% |
| Laotians | 98.6 /100 | #70 | Exceptional 28.5% |
| Jordanians | 98.5 /100 | #71 | Exceptional 28.5% |
| Immigrants | Sweden | 98.5 /100 | #72 | Exceptional 28.5% |
| Albanians | 98.5 /100 | #73 | Exceptional 28.5% |
| Immigrants | Bolivia | 98.5 /100 | #74 | Exceptional 28.6% |
| Immigrants | Switzerland | 98.4 /100 | #75 | Exceptional 28.6% |
| Israelis | 98.4 /100 | #76 | Exceptional 28.6% |
| Immigrants | Northern Europe | 98.3 /100 | #77 | Exceptional 28.6% |