Native/Alaskan vs Liberian Births to Unmarried Women
COMPARE
Native/Alaskan
Liberian
Births to Unmarried Women
Births to Unmarried Women Comparison
Natives/Alaskans
Liberians
43.0%
BIRTHS TO UNMARRIED WOMEN
0.0/ 100
METRIC RATING
331st/ 347
METRIC RANK
37.4%
BIRTHS TO UNMARRIED WOMEN
0.0/ 100
METRIC RATING
282nd/ 347
METRIC RANK
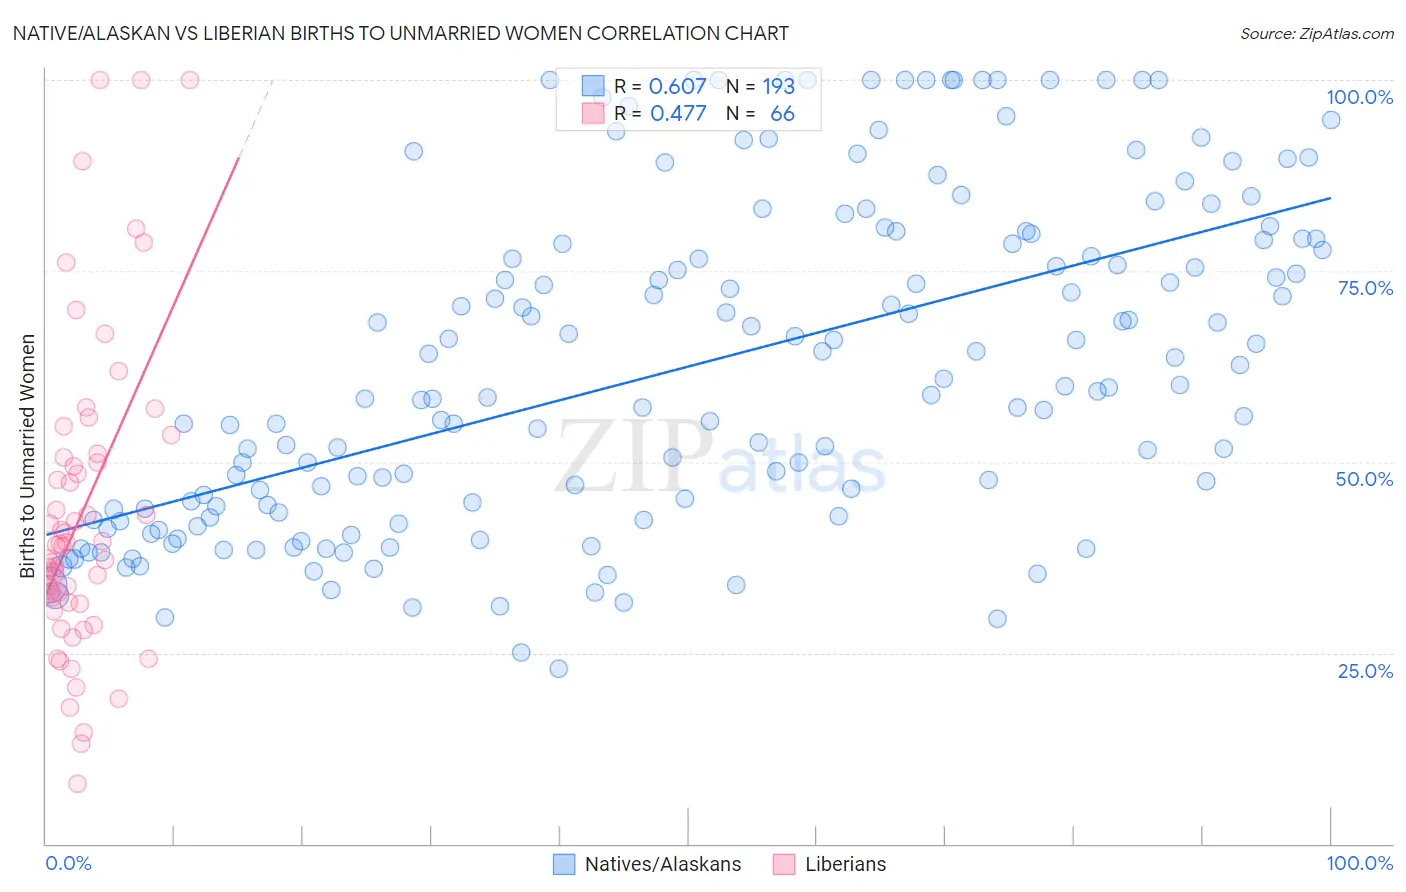
Native/Alaskan vs Liberian Births to Unmarried Women Correlation Chart
The statistical analysis conducted on geographies consisting of 471,404,476 people shows a significant positive correlation between the proportion of Natives/Alaskans and percentage of births to unmarried women in the United States with a correlation coefficient (R) of 0.607 and weighted average of 43.0%. Similarly, the statistical analysis conducted on geographies consisting of 116,121,082 people shows a moderate positive correlation between the proportion of Liberians and percentage of births to unmarried women in the United States with a correlation coefficient (R) of 0.477 and weighted average of 37.4%, a difference of 15.0%.
Births to Unmarried Women Correlation Summary
| Measurement | Native/Alaskan | Liberian |
| Minimum | 22.9% | 7.8% |
| Maximum | 100.0% | 100.0% |
| Range | 77.1% | 92.2% |
| Mean | 62.5% | 43.2% |
| Median | 59.8% | 39.0% |
| Interquartile 25% (IQ1) | 43.2% | 31.6% |
| Interquartile 75% (IQ3) | 79.1% | 50.5% |
| Interquartile Range (IQR) | 35.9% | 18.9% |
| Standard Deviation (Sample) | 21.3% | 20.4% |
| Standard Deviation (Population) | 21.3% | 20.2% |
Similar Demographics by Births to Unmarried Women
Demographics Similar to Natives/Alaskans by Births to Unmarried Women
In terms of births to unmarried women, the demographic groups most similar to Natives/Alaskans are Kiowa (43.1%, a difference of 0.35%), Chippewa (42.6%, a difference of 0.83%), Paiute (42.5%, a difference of 1.2%), Immigrants from Cabo Verde (42.2%, a difference of 1.8%), and Tsimshian (42.2%, a difference of 2.0%).
| Demographics | Rating | Rank | Births to Unmarried Women |
| Cape Verdeans | 0.0 /100 | #324 | Tragic 41.3% |
| Cheyenne | 0.0 /100 | #325 | Tragic 41.3% |
| Immigrants | Cuba | 0.0 /100 | #326 | Tragic 41.5% |
| Tsimshian | 0.0 /100 | #327 | Tragic 42.2% |
| Immigrants | Cabo Verde | 0.0 /100 | #328 | Tragic 42.2% |
| Paiute | 0.0 /100 | #329 | Tragic 42.5% |
| Chippewa | 0.0 /100 | #330 | Tragic 42.6% |
| Natives/Alaskans | 0.0 /100 | #331 | Tragic 43.0% |
| Kiowa | 0.0 /100 | #332 | Tragic 43.1% |
| Blacks/African Americans | 0.0 /100 | #333 | Tragic 44.3% |
| Yuman | 0.0 /100 | #334 | Tragic 44.4% |
| Colville | 0.0 /100 | #335 | Tragic 45.3% |
| Puerto Ricans | 0.0 /100 | #336 | Tragic 45.7% |
| Houma | 0.0 /100 | #337 | Tragic 46.6% |
| Arapaho | 0.0 /100 | #338 | Tragic 47.1% |
Demographics Similar to Liberians by Births to Unmarried Women
In terms of births to unmarried women, the demographic groups most similar to Liberians are Spanish American Indian (37.4%, a difference of 0.080%), Immigrants from Central America (37.4%, a difference of 0.14%), Immigrants from Belize (37.3%, a difference of 0.17%), Immigrants from St. Vincent and the Grenadines (37.3%, a difference of 0.18%), and Immigrants from Mexico (37.5%, a difference of 0.24%).
| Demographics | Rating | Rank | Births to Unmarried Women |
| Barbadians | 0.1 /100 | #275 | Tragic 37.0% |
| Belizeans | 0.1 /100 | #276 | Tragic 37.0% |
| Guatemalans | 0.1 /100 | #277 | Tragic 37.1% |
| Immigrants | Latin America | 0.1 /100 | #278 | Tragic 37.1% |
| West Indians | 0.1 /100 | #279 | Tragic 37.3% |
| Immigrants | St. Vincent and the Grenadines | 0.1 /100 | #280 | Tragic 37.3% |
| Immigrants | Belize | 0.1 /100 | #281 | Tragic 37.3% |
| Liberians | 0.0 /100 | #282 | Tragic 37.4% |
| Spanish American Indians | 0.0 /100 | #283 | Tragic 37.4% |
| Immigrants | Central America | 0.0 /100 | #284 | Tragic 37.4% |
| Immigrants | Mexico | 0.0 /100 | #285 | Tragic 37.5% |
| Immigrants | Guatemala | 0.0 /100 | #286 | Tragic 37.5% |
| Creek | 0.0 /100 | #287 | Tragic 37.6% |
| Immigrants | Liberia | 0.0 /100 | #288 | Tragic 37.6% |
| Alaskan Athabascans | 0.0 /100 | #289 | Tragic 37.7% |