Immigrants from Jamaica vs Icelander Births to Unmarried Women
COMPARE
Immigrants from Jamaica
Icelander
Births to Unmarried Women
Births to Unmarried Women Comparison
Immigrants from Jamaica
Icelanders
38.8%
BIRTHS TO UNMARRIED WOMEN
0.0/ 100
METRIC RATING
303rd/ 347
METRIC RANK
30.3%
BIRTHS TO UNMARRIED WOMEN
86.0/ 100
METRIC RATING
128th/ 347
METRIC RANK
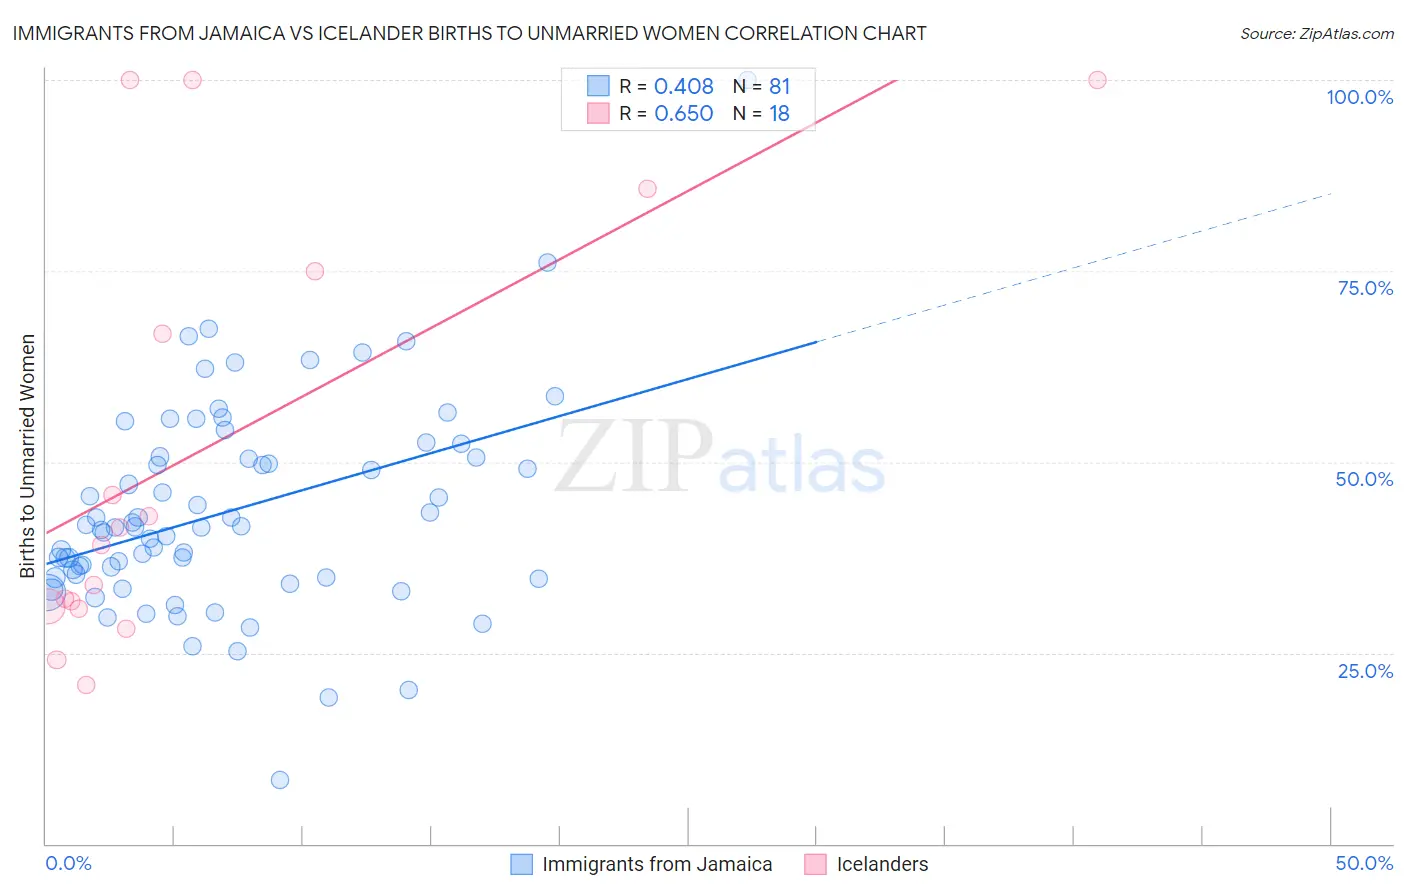
Immigrants from Jamaica vs Icelander Births to Unmarried Women Correlation Chart
The statistical analysis conducted on geographies consisting of 287,311,689 people shows a moderate positive correlation between the proportion of Immigrants from Jamaica and percentage of births to unmarried women in the United States with a correlation coefficient (R) of 0.408 and weighted average of 38.8%. Similarly, the statistical analysis conducted on geographies consisting of 153,143,056 people shows a significant positive correlation between the proportion of Icelanders and percentage of births to unmarried women in the United States with a correlation coefficient (R) of 0.650 and weighted average of 30.3%, a difference of 28.0%.
Births to Unmarried Women Correlation Summary
| Measurement | Immigrants from Jamaica | Icelander |
| Minimum | 8.3% | 20.8% |
| Maximum | 100.0% | 100.0% |
| Range | 91.7% | 79.2% |
| Mean | 43.5% | 51.6% |
| Median | 41.4% | 40.2% |
| Interquartile 25% (IQ1) | 34.8% | 31.0% |
| Interquartile 75% (IQ3) | 50.6% | 75.0% |
| Interquartile Range (IQR) | 15.8% | 44.0% |
| Standard Deviation (Sample) | 13.7% | 28.2% |
| Standard Deviation (Population) | 13.6% | 27.4% |
Similar Demographics by Births to Unmarried Women
Demographics Similar to Immigrants from Jamaica by Births to Unmarried Women
In terms of births to unmarried women, the demographic groups most similar to Immigrants from Jamaica are Yaqui (38.8%, a difference of 0.050%), Immigrants from Haiti (38.9%, a difference of 0.15%), Honduran (38.7%, a difference of 0.32%), Central American Indian (39.0%, a difference of 0.44%), and Haitian (38.6%, a difference of 0.56%).
| Demographics | Rating | Rank | Births to Unmarried Women |
| Alaska Natives | 0.0 /100 | #296 | Tragic 38.3% |
| Dutch West Indians | 0.0 /100 | #297 | Tragic 38.4% |
| Jamaicans | 0.0 /100 | #298 | Tragic 38.5% |
| Spanish Americans | 0.0 /100 | #299 | Tragic 38.6% |
| Immigrants | West Indies | 0.0 /100 | #300 | Tragic 38.6% |
| Haitians | 0.0 /100 | #301 | Tragic 38.6% |
| Hondurans | 0.0 /100 | #302 | Tragic 38.7% |
| Immigrants | Jamaica | 0.0 /100 | #303 | Tragic 38.8% |
| Yaqui | 0.0 /100 | #304 | Tragic 38.8% |
| Immigrants | Haiti | 0.0 /100 | #305 | Tragic 38.9% |
| Central American Indians | 0.0 /100 | #306 | Tragic 39.0% |
| Immigrants | Honduras | 0.0 /100 | #307 | Tragic 39.3% |
| Aleuts | 0.0 /100 | #308 | Tragic 39.3% |
| Cubans | 0.0 /100 | #309 | Tragic 39.4% |
| Immigrants | Dominica | 0.0 /100 | #310 | Tragic 39.5% |
Demographics Similar to Icelanders by Births to Unmarried Women
In terms of births to unmarried women, the demographic groups most similar to Icelanders are Immigrants from Spain (30.3%, a difference of 0.040%), Immigrants from Bosnia and Herzegovina (30.3%, a difference of 0.050%), Immigrants from Zimbabwe (30.3%, a difference of 0.060%), New Zealander (30.3%, a difference of 0.10%), and Immigrants from Morocco (30.4%, a difference of 0.15%).
| Demographics | Rating | Rank | Births to Unmarried Women |
| Koreans | 88.9 /100 | #121 | Excellent 30.1% |
| Immigrants | Argentina | 88.7 /100 | #122 | Excellent 30.1% |
| Syrians | 88.2 /100 | #123 | Excellent 30.2% |
| Croatians | 88.0 /100 | #124 | Excellent 30.2% |
| Vietnamese | 87.7 /100 | #125 | Excellent 30.2% |
| Europeans | 87.2 /100 | #126 | Excellent 30.2% |
| Chinese | 87.1 /100 | #127 | Excellent 30.2% |
| Icelanders | 86.0 /100 | #128 | Excellent 30.3% |
| Immigrants | Spain | 85.8 /100 | #129 | Excellent 30.3% |
| Immigrants | Bosnia and Herzegovina | 85.7 /100 | #130 | Excellent 30.3% |
| Immigrants | Zimbabwe | 85.7 /100 | #131 | Excellent 30.3% |
| New Zealanders | 85.5 /100 | #132 | Excellent 30.3% |
| Immigrants | Morocco | 85.2 /100 | #133 | Excellent 30.4% |
| Immigrants | South Eastern Asia | 85.2 /100 | #134 | Excellent 30.4% |
| Brazilians | 84.8 /100 | #135 | Excellent 30.4% |