Native/Alaskan vs Alaskan Athabascan Births to Unmarried Women
COMPARE
Native/Alaskan
Alaskan Athabascan
Births to Unmarried Women
Births to Unmarried Women Comparison
Natives/Alaskans
Alaskan Athabascans
43.0%
BIRTHS TO UNMARRIED WOMEN
0.0/ 100
METRIC RATING
331st/ 347
METRIC RANK
37.7%
BIRTHS TO UNMARRIED WOMEN
0.0/ 100
METRIC RATING
289th/ 347
METRIC RANK
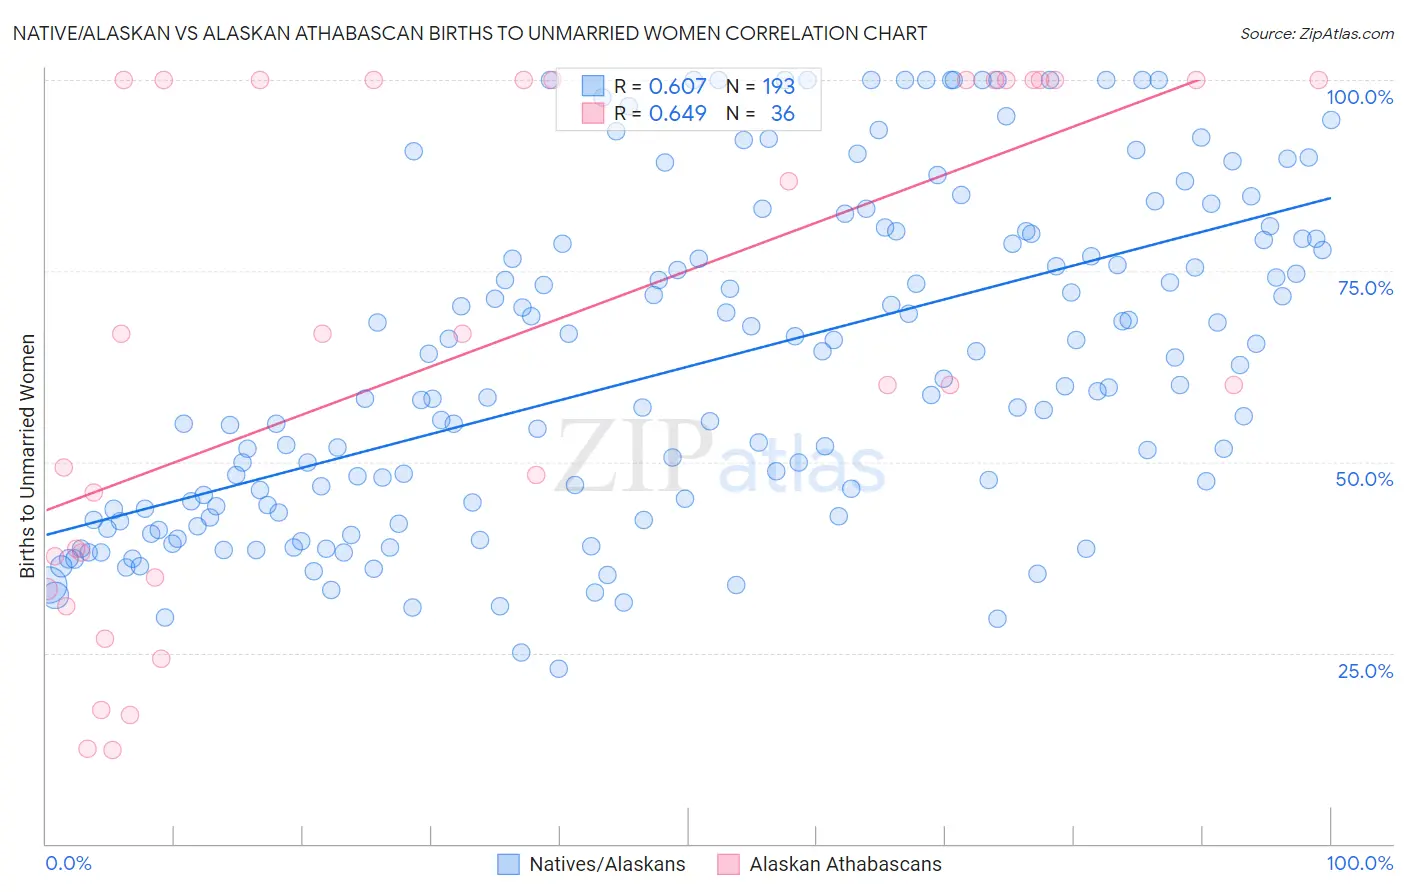
Native/Alaskan vs Alaskan Athabascan Births to Unmarried Women Correlation Chart
The statistical analysis conducted on geographies consisting of 471,404,476 people shows a significant positive correlation between the proportion of Natives/Alaskans and percentage of births to unmarried women in the United States with a correlation coefficient (R) of 0.607 and weighted average of 43.0%. Similarly, the statistical analysis conducted on geographies consisting of 44,775,598 people shows a significant positive correlation between the proportion of Alaskan Athabascans and percentage of births to unmarried women in the United States with a correlation coefficient (R) of 0.649 and weighted average of 37.7%, a difference of 14.0%.
Births to Unmarried Women Correlation Summary
| Measurement | Native/Alaskan | Alaskan Athabascan |
| Minimum | 22.9% | 12.2% |
| Maximum | 100.0% | 100.0% |
| Range | 77.1% | 87.8% |
| Mean | 62.5% | 64.8% |
| Median | 59.8% | 63.4% |
| Interquartile 25% (IQ1) | 43.2% | 36.2% |
| Interquartile 75% (IQ3) | 79.1% | 100.0% |
| Interquartile Range (IQR) | 35.9% | 63.8% |
| Standard Deviation (Sample) | 21.3% | 32.5% |
| Standard Deviation (Population) | 21.3% | 32.1% |
Similar Demographics by Births to Unmarried Women
Demographics Similar to Natives/Alaskans by Births to Unmarried Women
In terms of births to unmarried women, the demographic groups most similar to Natives/Alaskans are Kiowa (43.1%, a difference of 0.35%), Chippewa (42.6%, a difference of 0.83%), Paiute (42.5%, a difference of 1.2%), Immigrants from Cabo Verde (42.2%, a difference of 1.8%), and Tsimshian (42.2%, a difference of 2.0%).
| Demographics | Rating | Rank | Births to Unmarried Women |
| Cape Verdeans | 0.0 /100 | #324 | Tragic 41.3% |
| Cheyenne | 0.0 /100 | #325 | Tragic 41.3% |
| Immigrants | Cuba | 0.0 /100 | #326 | Tragic 41.5% |
| Tsimshian | 0.0 /100 | #327 | Tragic 42.2% |
| Immigrants | Cabo Verde | 0.0 /100 | #328 | Tragic 42.2% |
| Paiute | 0.0 /100 | #329 | Tragic 42.5% |
| Chippewa | 0.0 /100 | #330 | Tragic 42.6% |
| Natives/Alaskans | 0.0 /100 | #331 | Tragic 43.0% |
| Kiowa | 0.0 /100 | #332 | Tragic 43.1% |
| Blacks/African Americans | 0.0 /100 | #333 | Tragic 44.3% |
| Yuman | 0.0 /100 | #334 | Tragic 44.4% |
| Colville | 0.0 /100 | #335 | Tragic 45.3% |
| Puerto Ricans | 0.0 /100 | #336 | Tragic 45.7% |
| Houma | 0.0 /100 | #337 | Tragic 46.6% |
| Arapaho | 0.0 /100 | #338 | Tragic 47.1% |
Demographics Similar to Alaskan Athabascans by Births to Unmarried Women
In terms of births to unmarried women, the demographic groups most similar to Alaskan Athabascans are Hispanic or Latino (37.8%, a difference of 0.14%), Immigrants from Liberia (37.6%, a difference of 0.23%), Creek (37.6%, a difference of 0.40%), Seminole (37.9%, a difference of 0.48%), and Blackfeet (37.9%, a difference of 0.52%).
| Demographics | Rating | Rank | Births to Unmarried Women |
| Liberians | 0.0 /100 | #282 | Tragic 37.4% |
| Spanish American Indians | 0.0 /100 | #283 | Tragic 37.4% |
| Immigrants | Central America | 0.0 /100 | #284 | Tragic 37.4% |
| Immigrants | Mexico | 0.0 /100 | #285 | Tragic 37.5% |
| Immigrants | Guatemala | 0.0 /100 | #286 | Tragic 37.5% |
| Creek | 0.0 /100 | #287 | Tragic 37.6% |
| Immigrants | Liberia | 0.0 /100 | #288 | Tragic 37.6% |
| Alaskan Athabascans | 0.0 /100 | #289 | Tragic 37.7% |
| Hispanics or Latinos | 0.0 /100 | #290 | Tragic 37.8% |
| Seminole | 0.0 /100 | #291 | Tragic 37.9% |
| Blackfeet | 0.0 /100 | #292 | Tragic 37.9% |
| Immigrants | Nicaragua | 0.0 /100 | #293 | Tragic 38.0% |
| British West Indians | 0.0 /100 | #294 | Tragic 38.0% |
| Iroquois | 0.0 /100 | #295 | Tragic 38.2% |
| Alaska Natives | 0.0 /100 | #296 | Tragic 38.3% |