Native/Alaskan vs Dutch Births to Unmarried Women
COMPARE
Native/Alaskan
Dutch
Births to Unmarried Women
Births to Unmarried Women Comparison
Natives/Alaskans
Dutch
43.0%
BIRTHS TO UNMARRIED WOMEN
0.0/ 100
METRIC RATING
331st/ 347
METRIC RANK
31.5%
BIRTHS TO UNMARRIED WOMEN
55.3/ 100
METRIC RATING
167th/ 347
METRIC RANK
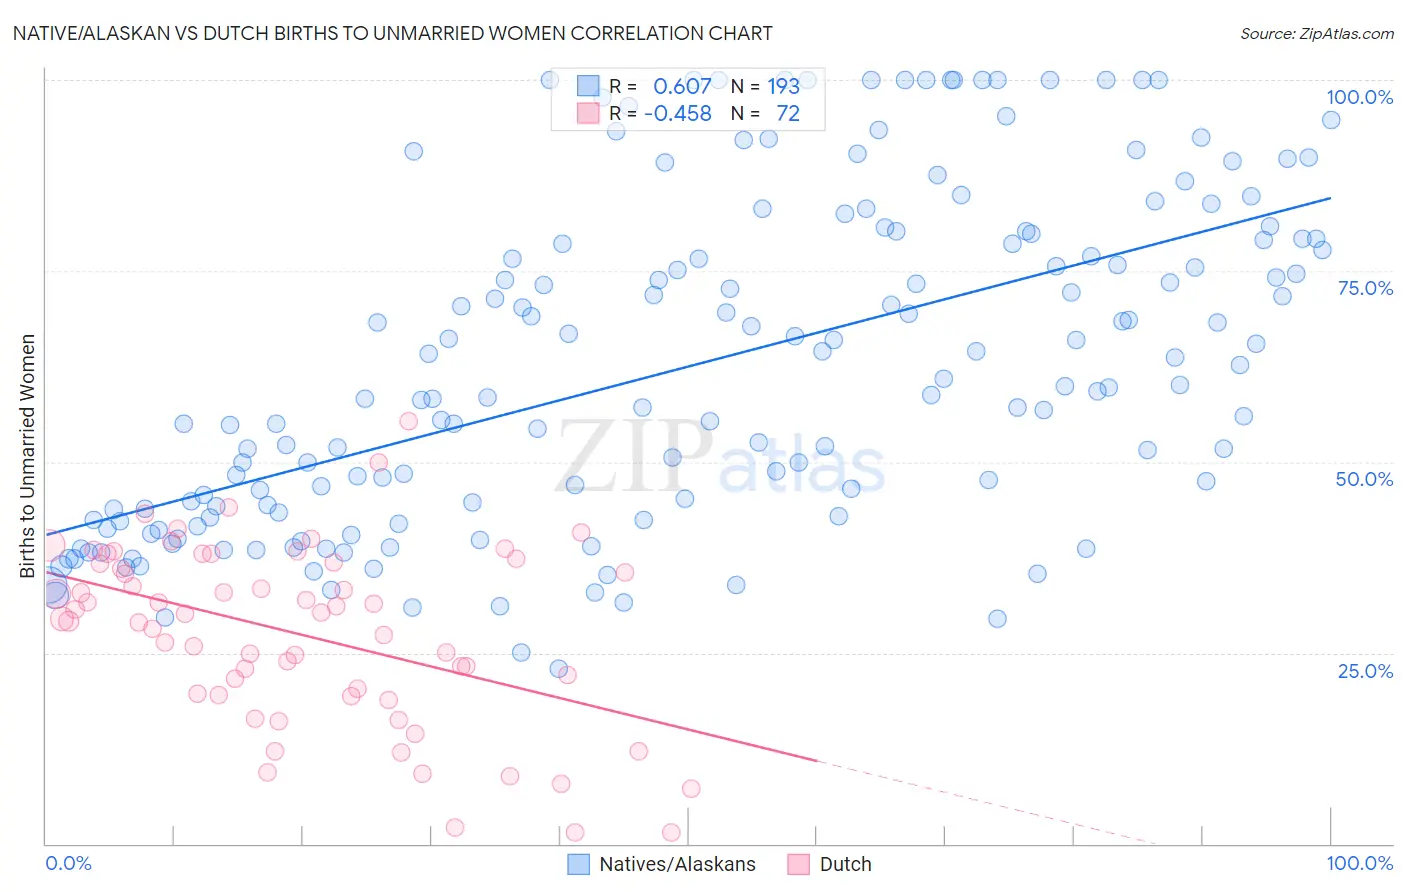
Native/Alaskan vs Dutch Births to Unmarried Women Correlation Chart
The statistical analysis conducted on geographies consisting of 471,404,476 people shows a significant positive correlation between the proportion of Natives/Alaskans and percentage of births to unmarried women in the United States with a correlation coefficient (R) of 0.607 and weighted average of 43.0%. Similarly, the statistical analysis conducted on geographies consisting of 493,194,115 people shows a moderate negative correlation between the proportion of Dutch and percentage of births to unmarried women in the United States with a correlation coefficient (R) of -0.458 and weighted average of 31.5%, a difference of 36.4%.
Births to Unmarried Women Correlation Summary
| Measurement | Native/Alaskan | Dutch |
| Minimum | 22.9% | 1.4% |
| Maximum | 100.0% | 55.3% |
| Range | 77.1% | 53.9% |
| Mean | 62.5% | 27.5% |
| Median | 59.8% | 29.8% |
| Interquartile 25% (IQ1) | 43.2% | 19.6% |
| Interquartile 75% (IQ3) | 79.1% | 36.7% |
| Interquartile Range (IQR) | 35.9% | 17.2% |
| Standard Deviation (Sample) | 21.3% | 11.7% |
| Standard Deviation (Population) | 21.3% | 11.6% |
Similar Demographics by Births to Unmarried Women
Demographics Similar to Natives/Alaskans by Births to Unmarried Women
In terms of births to unmarried women, the demographic groups most similar to Natives/Alaskans are Kiowa (43.1%, a difference of 0.35%), Chippewa (42.6%, a difference of 0.83%), Paiute (42.5%, a difference of 1.2%), Immigrants from Cabo Verde (42.2%, a difference of 1.8%), and Tsimshian (42.2%, a difference of 2.0%).
| Demographics | Rating | Rank | Births to Unmarried Women |
| Cape Verdeans | 0.0 /100 | #324 | Tragic 41.3% |
| Cheyenne | 0.0 /100 | #325 | Tragic 41.3% |
| Immigrants | Cuba | 0.0 /100 | #326 | Tragic 41.5% |
| Tsimshian | 0.0 /100 | #327 | Tragic 42.2% |
| Immigrants | Cabo Verde | 0.0 /100 | #328 | Tragic 42.2% |
| Paiute | 0.0 /100 | #329 | Tragic 42.5% |
| Chippewa | 0.0 /100 | #330 | Tragic 42.6% |
| Natives/Alaskans | 0.0 /100 | #331 | Tragic 43.0% |
| Kiowa | 0.0 /100 | #332 | Tragic 43.1% |
| Blacks/African Americans | 0.0 /100 | #333 | Tragic 44.3% |
| Yuman | 0.0 /100 | #334 | Tragic 44.4% |
| Colville | 0.0 /100 | #335 | Tragic 45.3% |
| Puerto Ricans | 0.0 /100 | #336 | Tragic 45.7% |
| Houma | 0.0 /100 | #337 | Tragic 46.6% |
| Arapaho | 0.0 /100 | #338 | Tragic 47.1% |
Demographics Similar to Dutch by Births to Unmarried Women
In terms of births to unmarried women, the demographic groups most similar to Dutch are Peruvian (31.5%, a difference of 0.030%), Belgian (31.6%, a difference of 0.27%), Immigrants from Somalia (31.4%, a difference of 0.28%), Slavic (31.6%, a difference of 0.31%), and Guamanian/Chamorro (31.6%, a difference of 0.38%).
| Demographics | Rating | Rank | Births to Unmarried Women |
| Immigrants | Western Europe | 69.3 /100 | #160 | Good 31.1% |
| Immigrants | Southern Europe | 68.7 /100 | #161 | Good 31.1% |
| Slovenes | 65.9 /100 | #162 | Good 31.2% |
| Immigrants | Chile | 65.7 /100 | #163 | Good 31.2% |
| Hungarians | 64.1 /100 | #164 | Good 31.2% |
| Immigrants | Somalia | 58.1 /100 | #165 | Average 31.4% |
| Peruvians | 55.5 /100 | #166 | Average 31.5% |
| Dutch | 55.3 /100 | #167 | Average 31.5% |
| Belgians | 52.4 /100 | #168 | Average 31.6% |
| Slavs | 52.0 /100 | #169 | Average 31.6% |
| Guamanians/Chamorros | 51.3 /100 | #170 | Average 31.6% |
| Finns | 50.5 /100 | #171 | Average 31.7% |
| Immigrants | Eritrea | 50.4 /100 | #172 | Average 31.7% |
| Immigrants | Yemen | 50.2 /100 | #173 | Average 31.7% |
| Venezuelans | 50.0 /100 | #174 | Average 31.7% |