Sioux vs Icelander Births to Unmarried Women
COMPARE
Sioux
Icelander
Births to Unmarried Women
Births to Unmarried Women Comparison
Sioux
Icelanders
41.0%
BIRTHS TO UNMARRIED WOMEN
0.0/ 100
METRIC RATING
323rd/ 347
METRIC RANK
30.3%
BIRTHS TO UNMARRIED WOMEN
86.0/ 100
METRIC RATING
128th/ 347
METRIC RANK
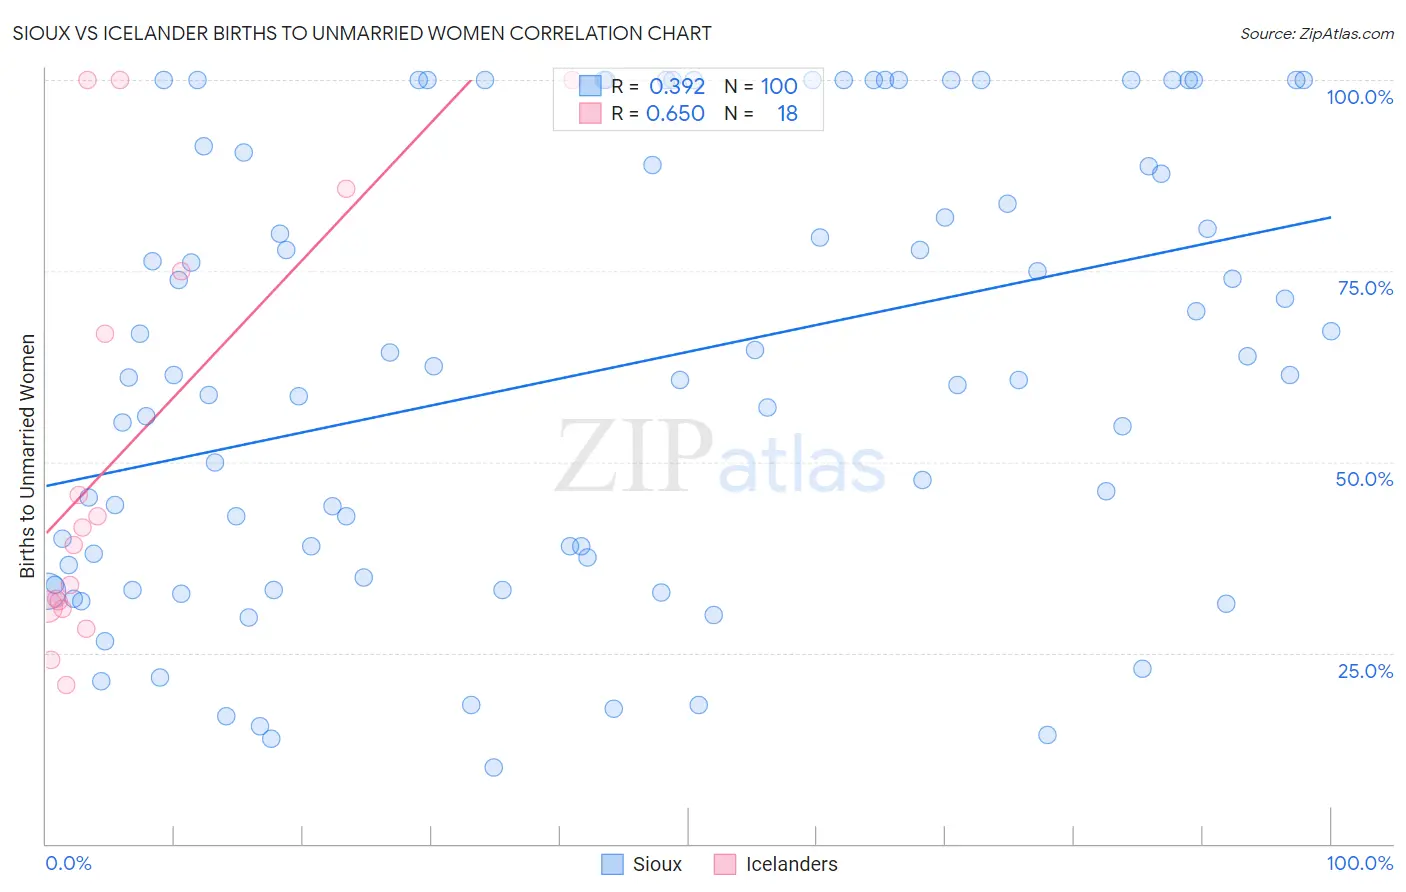
Sioux vs Icelander Births to Unmarried Women Correlation Chart
The statistical analysis conducted on geographies consisting of 224,573,646 people shows a mild positive correlation between the proportion of Sioux and percentage of births to unmarried women in the United States with a correlation coefficient (R) of 0.392 and weighted average of 41.0%. Similarly, the statistical analysis conducted on geographies consisting of 153,143,056 people shows a significant positive correlation between the proportion of Icelanders and percentage of births to unmarried women in the United States with a correlation coefficient (R) of 0.650 and weighted average of 30.3%, a difference of 35.2%.
Births to Unmarried Women Correlation Summary
| Measurement | Sioux | Icelander |
| Minimum | 10.0% | 20.8% |
| Maximum | 100.0% | 100.0% |
| Range | 90.0% | 79.2% |
| Mean | 61.9% | 51.6% |
| Median | 61.2% | 40.2% |
| Interquartile 25% (IQ1) | 35.7% | 31.0% |
| Interquartile 75% (IQ3) | 89.7% | 75.0% |
| Interquartile Range (IQR) | 54.0% | 44.0% |
| Standard Deviation (Sample) | 28.7% | 28.2% |
| Standard Deviation (Population) | 28.5% | 27.4% |
Similar Demographics by Births to Unmarried Women
Demographics Similar to Sioux by Births to Unmarried Women
In terms of births to unmarried women, the demographic groups most similar to Sioux are Cajun (41.0%, a difference of 0.070%), Bahamian (40.8%, a difference of 0.56%), Cape Verdean (41.3%, a difference of 0.80%), Cheyenne (41.3%, a difference of 0.85%), and Immigrants from Cuba (41.5%, a difference of 1.1%).
| Demographics | Rating | Rank | Births to Unmarried Women |
| Apache | 0.0 /100 | #316 | Tragic 39.9% |
| Immigrants | Dominican Republic | 0.0 /100 | #317 | Tragic 40.1% |
| Immigrants | Bahamas | 0.0 /100 | #318 | Tragic 40.1% |
| Yakama | 0.0 /100 | #319 | Tragic 40.3% |
| Crow | 0.0 /100 | #320 | Tragic 40.4% |
| Bahamians | 0.0 /100 | #321 | Tragic 40.8% |
| Cajuns | 0.0 /100 | #322 | Tragic 41.0% |
| Sioux | 0.0 /100 | #323 | Tragic 41.0% |
| Cape Verdeans | 0.0 /100 | #324 | Tragic 41.3% |
| Cheyenne | 0.0 /100 | #325 | Tragic 41.3% |
| Immigrants | Cuba | 0.0 /100 | #326 | Tragic 41.5% |
| Tsimshian | 0.0 /100 | #327 | Tragic 42.2% |
| Immigrants | Cabo Verde | 0.0 /100 | #328 | Tragic 42.2% |
| Paiute | 0.0 /100 | #329 | Tragic 42.5% |
| Chippewa | 0.0 /100 | #330 | Tragic 42.6% |
Demographics Similar to Icelanders by Births to Unmarried Women
In terms of births to unmarried women, the demographic groups most similar to Icelanders are Immigrants from Spain (30.3%, a difference of 0.040%), Immigrants from Bosnia and Herzegovina (30.3%, a difference of 0.050%), Immigrants from Zimbabwe (30.3%, a difference of 0.060%), New Zealander (30.3%, a difference of 0.10%), and Immigrants from Morocco (30.4%, a difference of 0.15%).
| Demographics | Rating | Rank | Births to Unmarried Women |
| Koreans | 88.9 /100 | #121 | Excellent 30.1% |
| Immigrants | Argentina | 88.7 /100 | #122 | Excellent 30.1% |
| Syrians | 88.2 /100 | #123 | Excellent 30.2% |
| Croatians | 88.0 /100 | #124 | Excellent 30.2% |
| Vietnamese | 87.7 /100 | #125 | Excellent 30.2% |
| Europeans | 87.2 /100 | #126 | Excellent 30.2% |
| Chinese | 87.1 /100 | #127 | Excellent 30.2% |
| Icelanders | 86.0 /100 | #128 | Excellent 30.3% |
| Immigrants | Spain | 85.8 /100 | #129 | Excellent 30.3% |
| Immigrants | Bosnia and Herzegovina | 85.7 /100 | #130 | Excellent 30.3% |
| Immigrants | Zimbabwe | 85.7 /100 | #131 | Excellent 30.3% |
| New Zealanders | 85.5 /100 | #132 | Excellent 30.3% |
| Immigrants | Morocco | 85.2 /100 | #133 | Excellent 30.4% |
| Immigrants | South Eastern Asia | 85.2 /100 | #134 | Excellent 30.4% |
| Brazilians | 84.8 /100 | #135 | Excellent 30.4% |