Native/Alaskan vs Immigrants from Iran Births to Unmarried Women
COMPARE
Native/Alaskan
Immigrants from Iran
Births to Unmarried Women
Births to Unmarried Women Comparison
Natives/Alaskans
Immigrants from Iran
43.0%
BIRTHS TO UNMARRIED WOMEN
0.0/ 100
METRIC RATING
331st/ 347
METRIC RANK
24.0%
BIRTHS TO UNMARRIED WOMEN
100.0/ 100
METRIC RATING
6th/ 347
METRIC RANK
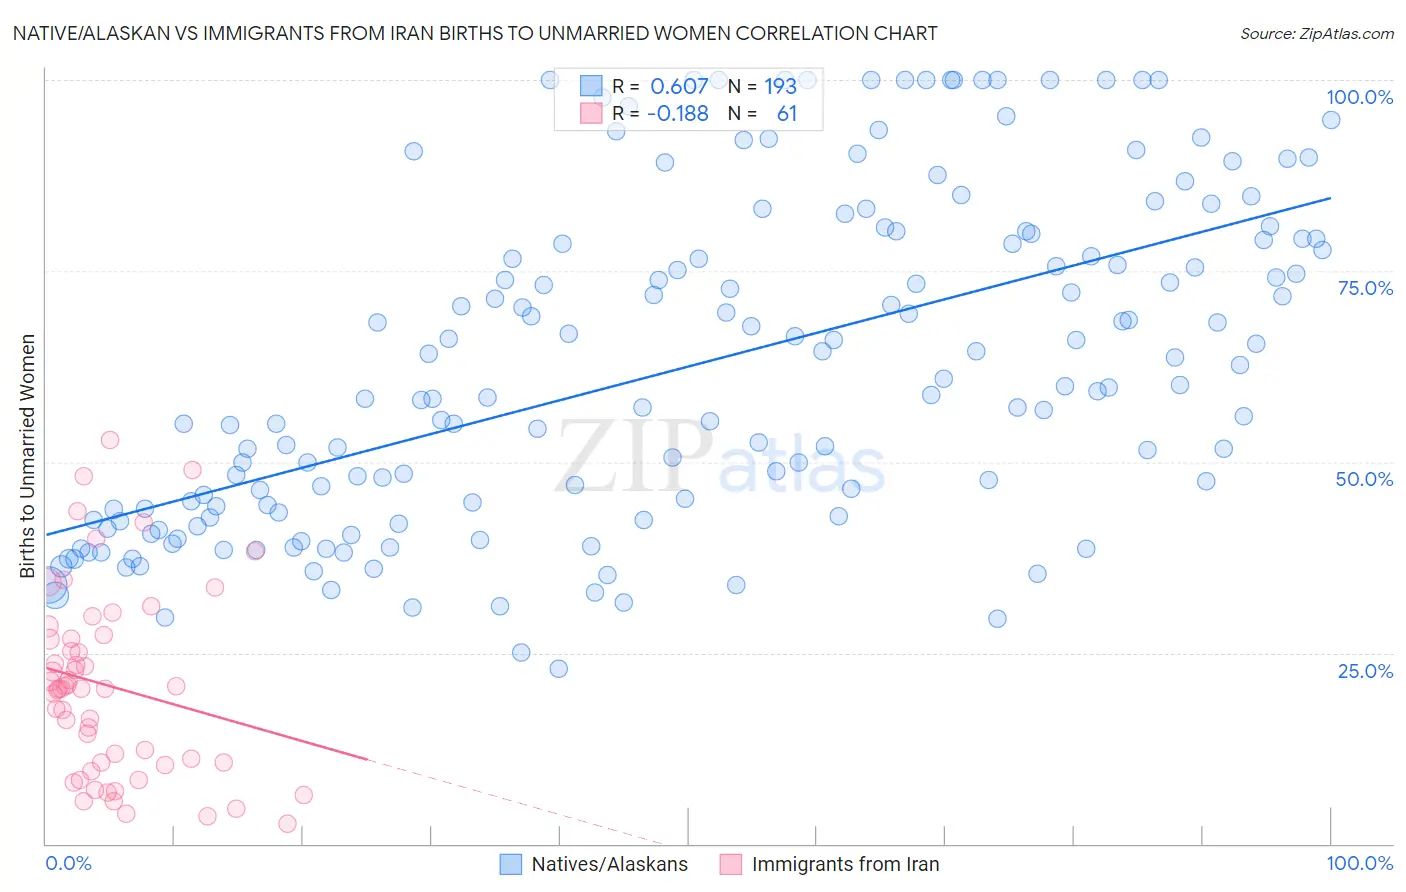
Native/Alaskan vs Immigrants from Iran Births to Unmarried Women Correlation Chart
The statistical analysis conducted on geographies consisting of 471,404,476 people shows a significant positive correlation between the proportion of Natives/Alaskans and percentage of births to unmarried women in the United States with a correlation coefficient (R) of 0.607 and weighted average of 43.0%. Similarly, the statistical analysis conducted on geographies consisting of 263,743,481 people shows a poor negative correlation between the proportion of Immigrants from Iran and percentage of births to unmarried women in the United States with a correlation coefficient (R) of -0.188 and weighted average of 24.0%, a difference of 79.4%.
Births to Unmarried Women Correlation Summary
| Measurement | Native/Alaskan | Immigrants from Iran |
| Minimum | 22.9% | 2.7% |
| Maximum | 100.0% | 52.8% |
| Range | 77.1% | 50.1% |
| Mean | 62.5% | 20.6% |
| Median | 59.8% | 20.3% |
| Interquartile 25% (IQ1) | 43.2% | 10.4% |
| Interquartile 75% (IQ3) | 79.1% | 27.1% |
| Interquartile Range (IQR) | 35.9% | 16.6% |
| Standard Deviation (Sample) | 21.3% | 12.2% |
| Standard Deviation (Population) | 21.3% | 12.1% |
Similar Demographics by Births to Unmarried Women
Demographics Similar to Natives/Alaskans by Births to Unmarried Women
In terms of births to unmarried women, the demographic groups most similar to Natives/Alaskans are Kiowa (43.1%, a difference of 0.35%), Chippewa (42.6%, a difference of 0.83%), Paiute (42.5%, a difference of 1.2%), Immigrants from Cabo Verde (42.2%, a difference of 1.8%), and Tsimshian (42.2%, a difference of 2.0%).
| Demographics | Rating | Rank | Births to Unmarried Women |
| Cape Verdeans | 0.0 /100 | #324 | Tragic 41.3% |
| Cheyenne | 0.0 /100 | #325 | Tragic 41.3% |
| Immigrants | Cuba | 0.0 /100 | #326 | Tragic 41.5% |
| Tsimshian | 0.0 /100 | #327 | Tragic 42.2% |
| Immigrants | Cabo Verde | 0.0 /100 | #328 | Tragic 42.2% |
| Paiute | 0.0 /100 | #329 | Tragic 42.5% |
| Chippewa | 0.0 /100 | #330 | Tragic 42.6% |
| Natives/Alaskans | 0.0 /100 | #331 | Tragic 43.0% |
| Kiowa | 0.0 /100 | #332 | Tragic 43.1% |
| Blacks/African Americans | 0.0 /100 | #333 | Tragic 44.3% |
| Yuman | 0.0 /100 | #334 | Tragic 44.4% |
| Colville | 0.0 /100 | #335 | Tragic 45.3% |
| Puerto Ricans | 0.0 /100 | #336 | Tragic 45.7% |
| Houma | 0.0 /100 | #337 | Tragic 46.6% |
| Arapaho | 0.0 /100 | #338 | Tragic 47.1% |
Demographics Similar to Immigrants from Iran by Births to Unmarried Women
In terms of births to unmarried women, the demographic groups most similar to Immigrants from Iran are Thai (24.0%, a difference of 0.29%), Immigrants from Hong Kong (23.6%, a difference of 1.6%), Immigrants from China (24.7%, a difference of 3.0%), Immigrants from South Central Asia (24.7%, a difference of 3.0%), and Immigrants from Taiwan (23.0%, a difference of 4.1%).
| Demographics | Rating | Rank | Births to Unmarried Women |
| Assyrians/Chaldeans/Syriacs | 100.0 /100 | #1 | Exceptional 22.0% |
| Immigrants | India | 100.0 /100 | #2 | Exceptional 22.9% |
| Filipinos | 100.0 /100 | #3 | Exceptional 23.0% |
| Immigrants | Taiwan | 100.0 /100 | #4 | Exceptional 23.0% |
| Immigrants | Hong Kong | 100.0 /100 | #5 | Exceptional 23.6% |
| Immigrants | Iran | 100.0 /100 | #6 | Exceptional 24.0% |
| Thais | 100.0 /100 | #7 | Exceptional 24.0% |
| Immigrants | China | 100.0 /100 | #8 | Exceptional 24.7% |
| Immigrants | South Central Asia | 100.0 /100 | #9 | Exceptional 24.7% |
| Immigrants | Eastern Asia | 100.0 /100 | #10 | Exceptional 25.0% |
| Immigrants | Israel | 100.0 /100 | #11 | Exceptional 25.1% |
| Indians (Asian) | 100.0 /100 | #12 | Exceptional 25.3% |
| Iranians | 100.0 /100 | #13 | Exceptional 25.3% |
| Immigrants | Lebanon | 100.0 /100 | #14 | Exceptional 25.3% |
| Immigrants | Singapore | 100.0 /100 | #15 | Exceptional 25.6% |