Malaysian vs Puget Sound Salish Family Households
COMPARE
Malaysian
Puget Sound Salish
Family Households
Family Households Comparison
Malaysians
Puget Sound Salish
65.9%
FAMILY HOUSEHOLDS
99.9/ 100
METRIC RATING
69th/ 347
METRIC RANK
65.6%
FAMILY HOUSEHOLDS
99.8/ 100
METRIC RATING
80th/ 347
METRIC RANK
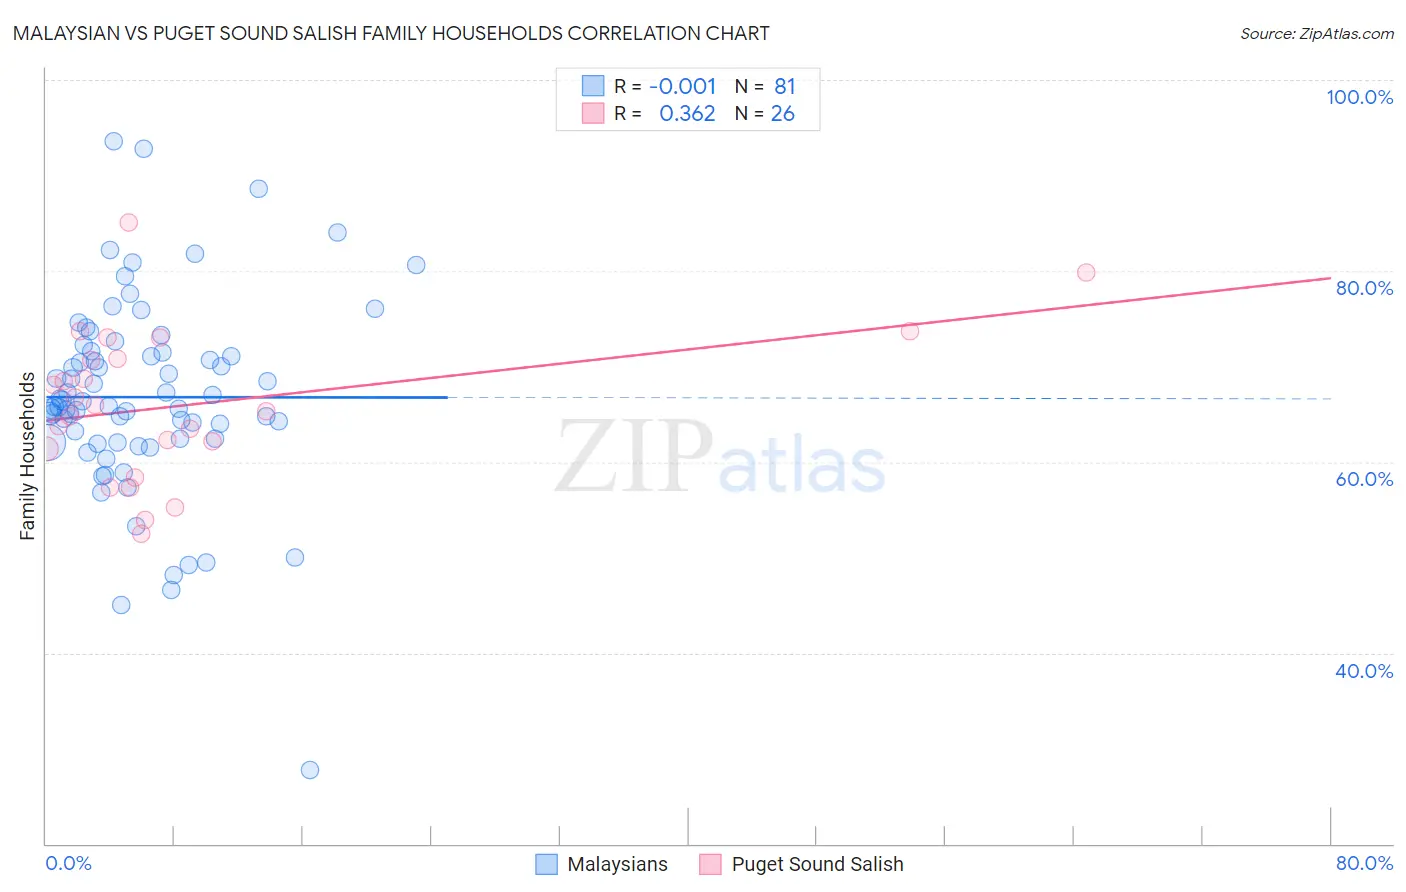
Malaysian vs Puget Sound Salish Family Households Correlation Chart
The statistical analysis conducted on geographies consisting of 226,012,303 people shows no correlation between the proportion of Malaysians and percentage of family households in the United States with a correlation coefficient (R) of -0.001 and weighted average of 65.9%. Similarly, the statistical analysis conducted on geographies consisting of 46,155,865 people shows a mild positive correlation between the proportion of Puget Sound Salish and percentage of family households in the United States with a correlation coefficient (R) of 0.362 and weighted average of 65.6%, a difference of 0.41%.
Family Households Correlation Summary
| Measurement | Malaysian | Puget Sound Salish |
| Minimum | 27.8% | 52.5% |
| Maximum | 93.6% | 85.1% |
| Range | 65.8% | 32.6% |
| Mean | 66.8% | 66.0% |
| Median | 65.9% | 65.6% |
| Interquartile 25% (IQ1) | 62.2% | 61.4% |
| Interquartile 75% (IQ3) | 71.5% | 70.8% |
| Interquartile Range (IQR) | 9.3% | 9.4% |
| Standard Deviation (Sample) | 10.3% | 7.9% |
| Standard Deviation (Population) | 10.3% | 7.7% |
Demographics Similar to Malaysians and Puget Sound Salish by Family Households
In terms of family households, the demographic groups most similar to Malaysians are Immigrants from Afghanistan (65.9%, a difference of 0.010%), Bhutanese (65.9%, a difference of 0.020%), Japanese (65.9%, a difference of 0.030%), Fijian (65.9%, a difference of 0.050%), and Filipino (65.9%, a difference of 0.050%). Similarly, the demographic groups most similar to Puget Sound Salish are Immigrants from Costa Rica (65.6%, a difference of 0.010%), Immigrants from South America (65.6%, a difference of 0.050%), Yaqui (65.6%, a difference of 0.050%), Immigrants from the Azores (65.6%, a difference of 0.060%), and Jordanian (65.5%, a difference of 0.080%).
| Demographics | Rating | Rank | Family Households |
| Pima | 99.9 /100 | #64 | Exceptional 65.9% |
| Costa Ricans | 99.9 /100 | #65 | Exceptional 65.9% |
| Fijians | 99.9 /100 | #66 | Exceptional 65.9% |
| Filipinos | 99.9 /100 | #67 | Exceptional 65.9% |
| Japanese | 99.9 /100 | #68 | Exceptional 65.9% |
| Malaysians | 99.9 /100 | #69 | Exceptional 65.9% |
| Immigrants | Afghanistan | 99.9 /100 | #70 | Exceptional 65.9% |
| Bhutanese | 99.9 /100 | #71 | Exceptional 65.9% |
| Portuguese | 99.9 /100 | #72 | Exceptional 65.8% |
| Laotians | 99.9 /100 | #73 | Exceptional 65.8% |
| Burmese | 99.9 /100 | #74 | Exceptional 65.7% |
| Houma | 99.9 /100 | #75 | Exceptional 65.7% |
| Immigrants | Azores | 99.8 /100 | #76 | Exceptional 65.6% |
| Immigrants | South America | 99.8 /100 | #77 | Exceptional 65.6% |
| Yaqui | 99.8 /100 | #78 | Exceptional 65.6% |
| Immigrants | Costa Rica | 99.8 /100 | #79 | Exceptional 65.6% |
| Puget Sound Salish | 99.8 /100 | #80 | Exceptional 65.6% |
| Jordanians | 99.7 /100 | #81 | Exceptional 65.5% |
| Immigrants | Lebanon | 99.7 /100 | #82 | Exceptional 65.5% |
| Immigrants | Guyana | 99.6 /100 | #83 | Exceptional 65.5% |
| Americans | 99.6 /100 | #84 | Exceptional 65.5% |