Central American Indian vs Puget Sound Salish Family Households
COMPARE
Central American Indian
Puget Sound Salish
Family Households
Family Households Comparison
Central American Indians
Puget Sound Salish
65.2%
FAMILY HOUSEHOLDS
98.3/ 100
METRIC RATING
99th/ 347
METRIC RANK
65.6%
FAMILY HOUSEHOLDS
99.8/ 100
METRIC RATING
80th/ 347
METRIC RANK
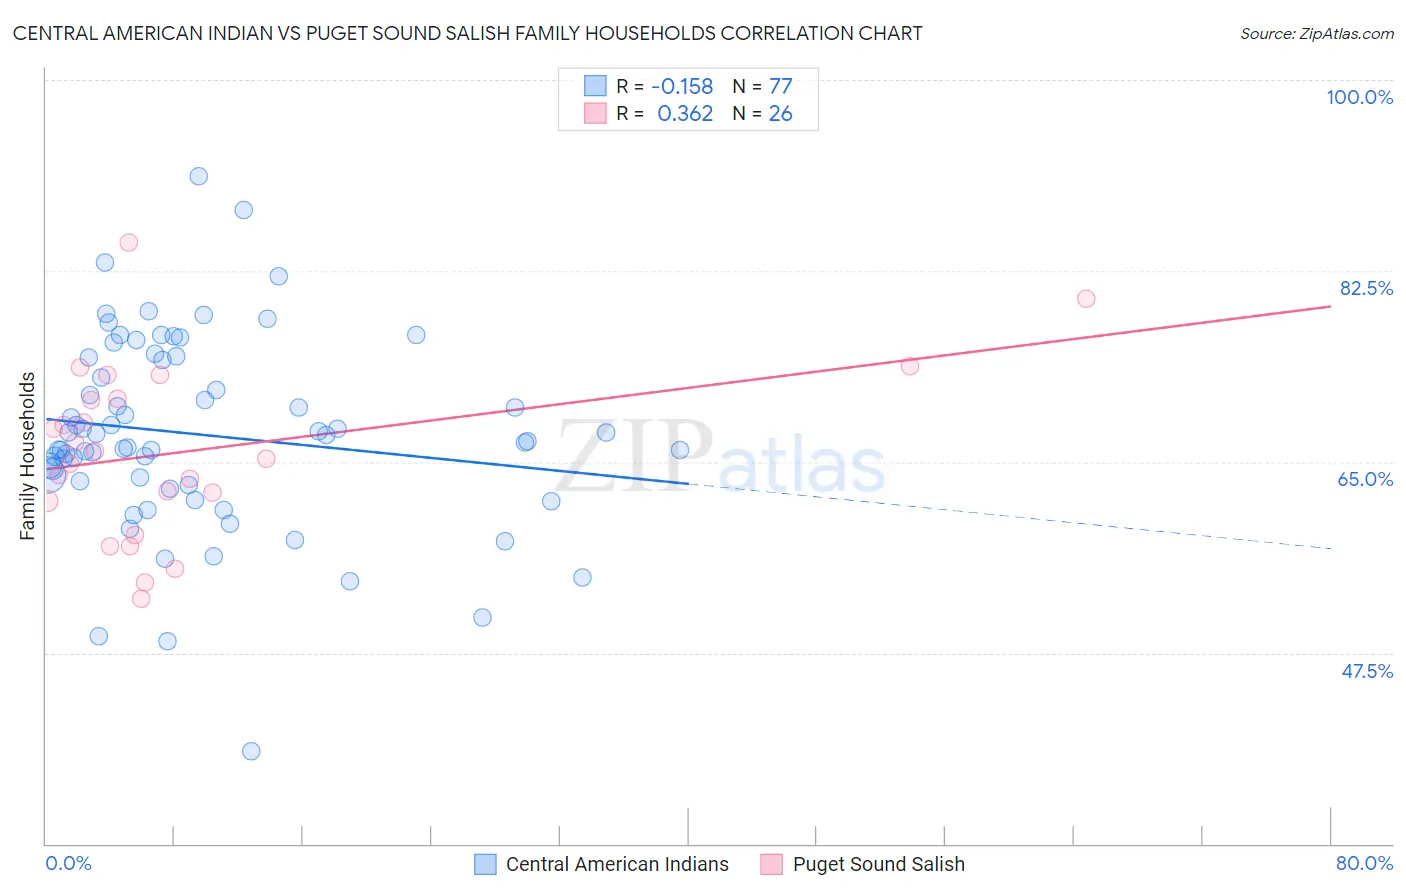
Central American Indian vs Puget Sound Salish Family Households Correlation Chart
The statistical analysis conducted on geographies consisting of 326,061,567 people shows a poor negative correlation between the proportion of Central American Indians and percentage of family households in the United States with a correlation coefficient (R) of -0.158 and weighted average of 65.2%. Similarly, the statistical analysis conducted on geographies consisting of 46,155,865 people shows a mild positive correlation between the proportion of Puget Sound Salish and percentage of family households in the United States with a correlation coefficient (R) of 0.362 and weighted average of 65.6%, a difference of 0.65%.
Family Households Correlation Summary
| Measurement | Central American Indian | Puget Sound Salish |
| Minimum | 38.5% | 52.5% |
| Maximum | 91.2% | 85.1% |
| Range | 52.8% | 32.6% |
| Mean | 67.5% | 66.0% |
| Median | 66.9% | 65.6% |
| Interquartile 25% (IQ1) | 63.1% | 61.4% |
| Interquartile 75% (IQ3) | 74.4% | 70.8% |
| Interquartile Range (IQR) | 11.3% | 9.4% |
| Standard Deviation (Sample) | 8.9% | 7.9% |
| Standard Deviation (Population) | 8.8% | 7.7% |
Demographics Similar to Central American Indians and Puget Sound Salish by Family Households
In terms of family households, the demographic groups most similar to Central American Indians are Immigrants from Syria (65.2%, a difference of 0.020%), Swiss (65.2%, a difference of 0.060%), Guatemalan (65.2%, a difference of 0.060%), Immigrants from Portugal (65.2%, a difference of 0.070%), and Immigrants from Poland (65.2%, a difference of 0.090%). Similarly, the demographic groups most similar to Puget Sound Salish are Immigrants from Costa Rica (65.6%, a difference of 0.010%), Jordanian (65.5%, a difference of 0.080%), Immigrants from Lebanon (65.5%, a difference of 0.12%), Immigrants from Guyana (65.5%, a difference of 0.13%), and American (65.5%, a difference of 0.14%).
| Demographics | Rating | Rank | Family Households |
| Immigrants | Costa Rica | 99.8 /100 | #79 | Exceptional 65.6% |
| Puget Sound Salish | 99.8 /100 | #80 | Exceptional 65.6% |
| Jordanians | 99.7 /100 | #81 | Exceptional 65.5% |
| Immigrants | Lebanon | 99.7 /100 | #82 | Exceptional 65.5% |
| Immigrants | Guyana | 99.6 /100 | #83 | Exceptional 65.5% |
| Americans | 99.6 /100 | #84 | Exceptional 65.5% |
| Immigrants | Cambodia | 99.5 /100 | #85 | Exceptional 65.4% |
| Egyptians | 99.4 /100 | #86 | Exceptional 65.4% |
| Immigrants | Egypt | 99.2 /100 | #87 | Exceptional 65.3% |
| Immigrants | Haiti | 99.1 /100 | #88 | Exceptional 65.3% |
| Immigrants | Caribbean | 99.1 /100 | #89 | Exceptional 65.3% |
| Immigrants | Laos | 99.1 /100 | #90 | Exceptional 65.3% |
| Crow | 98.9 /100 | #91 | Exceptional 65.3% |
| Hopi | 98.8 /100 | #92 | Exceptional 65.3% |
| Guyanese | 98.8 /100 | #93 | Exceptional 65.3% |
| Immigrants | Poland | 98.7 /100 | #94 | Exceptional 65.2% |
| Immigrants | Portugal | 98.6 /100 | #95 | Exceptional 65.2% |
| Swiss | 98.6 /100 | #96 | Exceptional 65.2% |
| Guatemalans | 98.6 /100 | #97 | Exceptional 65.2% |
| Immigrants | Syria | 98.4 /100 | #98 | Exceptional 65.2% |
| Central American Indians | 98.3 /100 | #99 | Exceptional 65.2% |