Immigrants from Canada vs Puget Sound Salish Family Households
COMPARE
Immigrants from Canada
Puget Sound Salish
Family Households
Family Households Comparison
Immigrants from Canada
Puget Sound Salish
64.0%
FAMILY HOUSEHOLDS
19.2/ 100
METRIC RATING
196th/ 347
METRIC RANK
65.6%
FAMILY HOUSEHOLDS
99.8/ 100
METRIC RATING
80th/ 347
METRIC RANK
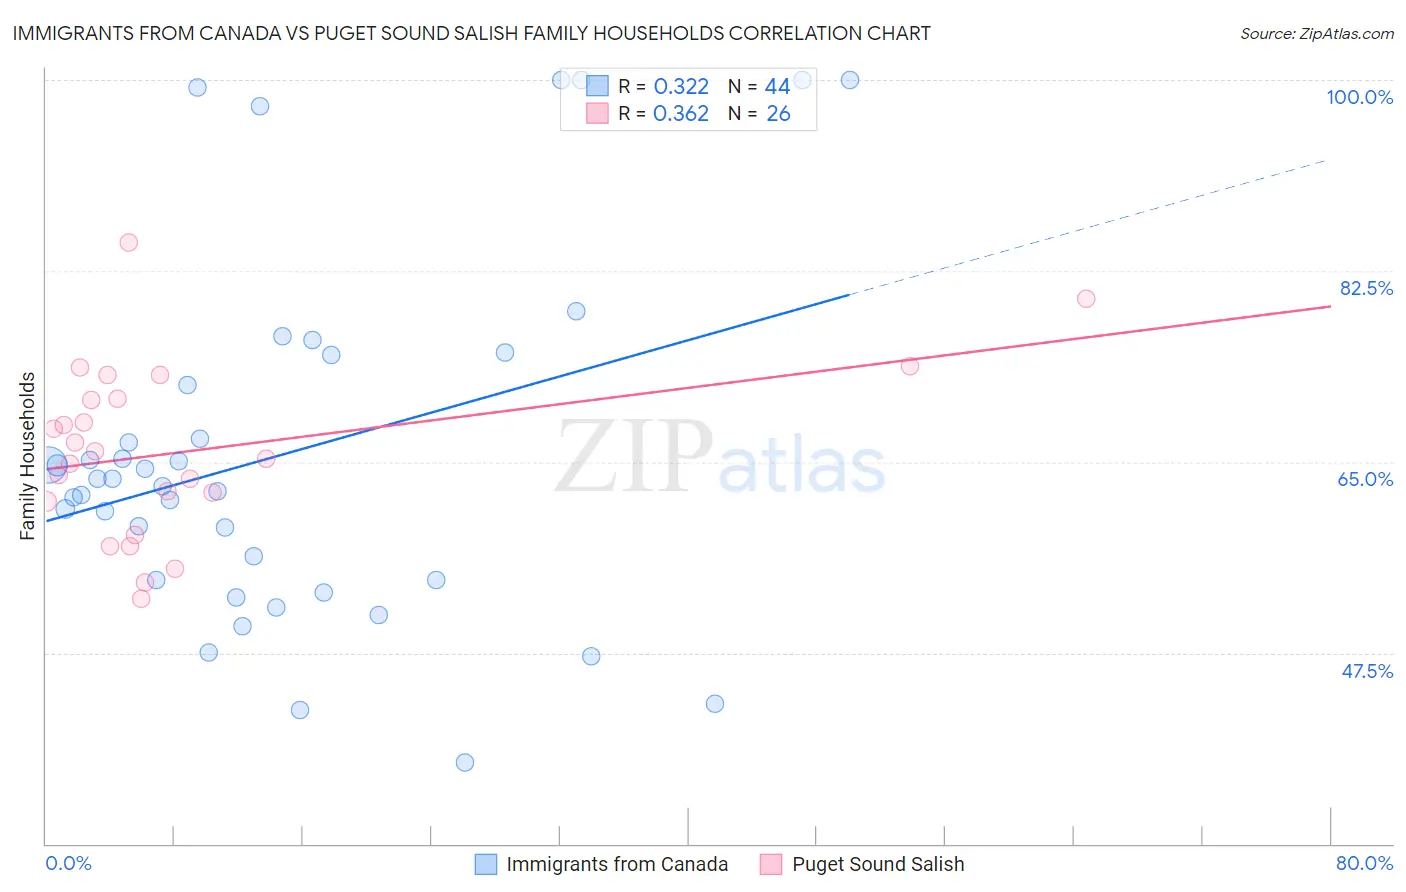
Immigrants from Canada vs Puget Sound Salish Family Households Correlation Chart
The statistical analysis conducted on geographies consisting of 459,128,452 people shows a mild positive correlation between the proportion of Immigrants from Canada and percentage of family households in the United States with a correlation coefficient (R) of 0.322 and weighted average of 64.0%. Similarly, the statistical analysis conducted on geographies consisting of 46,155,865 people shows a mild positive correlation between the proportion of Puget Sound Salish and percentage of family households in the United States with a correlation coefficient (R) of 0.362 and weighted average of 65.6%, a difference of 2.5%.
Family Households Correlation Summary
| Measurement | Immigrants from Canada | Puget Sound Salish |
| Minimum | 37.5% | 52.5% |
| Maximum | 100.0% | 85.1% |
| Range | 62.5% | 32.6% |
| Mean | 65.7% | 66.0% |
| Median | 63.1% | 65.6% |
| Interquartile 25% (IQ1) | 54.2% | 61.4% |
| Interquartile 75% (IQ3) | 73.4% | 70.8% |
| Interquartile Range (IQR) | 19.2% | 9.4% |
| Standard Deviation (Sample) | 16.4% | 7.9% |
| Standard Deviation (Population) | 16.2% | 7.7% |
Similar Demographics by Family Households
Demographics Similar to Immigrants from Canada by Family Households
In terms of family households, the demographic groups most similar to Immigrants from Canada are Seminole (64.0%, a difference of 0.010%), Polish (64.0%, a difference of 0.010%), Slavic (64.0%, a difference of 0.010%), Immigrants from North America (64.0%, a difference of 0.020%), and Immigrants from Malaysia (64.0%, a difference of 0.030%).
| Demographics | Rating | Rank | Family Households |
| Immigrants | Western Asia | 25.3 /100 | #189 | Fair 64.1% |
| Zimbabweans | 24.7 /100 | #190 | Fair 64.1% |
| Arabs | 24.5 /100 | #191 | Fair 64.1% |
| Lithuanians | 23.8 /100 | #192 | Fair 64.0% |
| French | 23.7 /100 | #193 | Fair 64.0% |
| Paiute | 22.2 /100 | #194 | Fair 64.0% |
| Immigrants | North America | 20.0 /100 | #195 | Poor 64.0% |
| Immigrants | Canada | 19.2 /100 | #196 | Poor 64.0% |
| Seminole | 18.9 /100 | #197 | Poor 64.0% |
| Poles | 18.9 /100 | #198 | Poor 64.0% |
| Slavs | 18.6 /100 | #199 | Poor 64.0% |
| Immigrants | Malaysia | 17.9 /100 | #200 | Poor 64.0% |
| Immigrants | Eastern Europe | 17.2 /100 | #201 | Poor 64.0% |
| Iranians | 13.5 /100 | #202 | Poor 63.9% |
| Norwegians | 13.2 /100 | #203 | Poor 63.9% |
Demographics Similar to Puget Sound Salish by Family Households
In terms of family households, the demographic groups most similar to Puget Sound Salish are Immigrants from Costa Rica (65.6%, a difference of 0.010%), Immigrants from South America (65.6%, a difference of 0.050%), Yaqui (65.6%, a difference of 0.050%), Immigrants from the Azores (65.6%, a difference of 0.060%), and Jordanian (65.5%, a difference of 0.080%).
| Demographics | Rating | Rank | Family Households |
| Laotians | 99.9 /100 | #73 | Exceptional 65.8% |
| Burmese | 99.9 /100 | #74 | Exceptional 65.7% |
| Houma | 99.9 /100 | #75 | Exceptional 65.7% |
| Immigrants | Azores | 99.8 /100 | #76 | Exceptional 65.6% |
| Immigrants | South America | 99.8 /100 | #77 | Exceptional 65.6% |
| Yaqui | 99.8 /100 | #78 | Exceptional 65.6% |
| Immigrants | Costa Rica | 99.8 /100 | #79 | Exceptional 65.6% |
| Puget Sound Salish | 99.8 /100 | #80 | Exceptional 65.6% |
| Jordanians | 99.7 /100 | #81 | Exceptional 65.5% |
| Immigrants | Lebanon | 99.7 /100 | #82 | Exceptional 65.5% |
| Immigrants | Guyana | 99.6 /100 | #83 | Exceptional 65.5% |
| Americans | 99.6 /100 | #84 | Exceptional 65.5% |
| Immigrants | Cambodia | 99.5 /100 | #85 | Exceptional 65.4% |
| Egyptians | 99.4 /100 | #86 | Exceptional 65.4% |
| Immigrants | Egypt | 99.2 /100 | #87 | Exceptional 65.3% |