Hungarian vs Puget Sound Salish Family Households
COMPARE
Hungarian
Puget Sound Salish
Family Households
Family Households Comparison
Hungarians
Puget Sound Salish
64.9%
FAMILY HOUSEHOLDS
94.0/ 100
METRIC RATING
121st/ 347
METRIC RANK
65.6%
FAMILY HOUSEHOLDS
99.8/ 100
METRIC RATING
80th/ 347
METRIC RANK
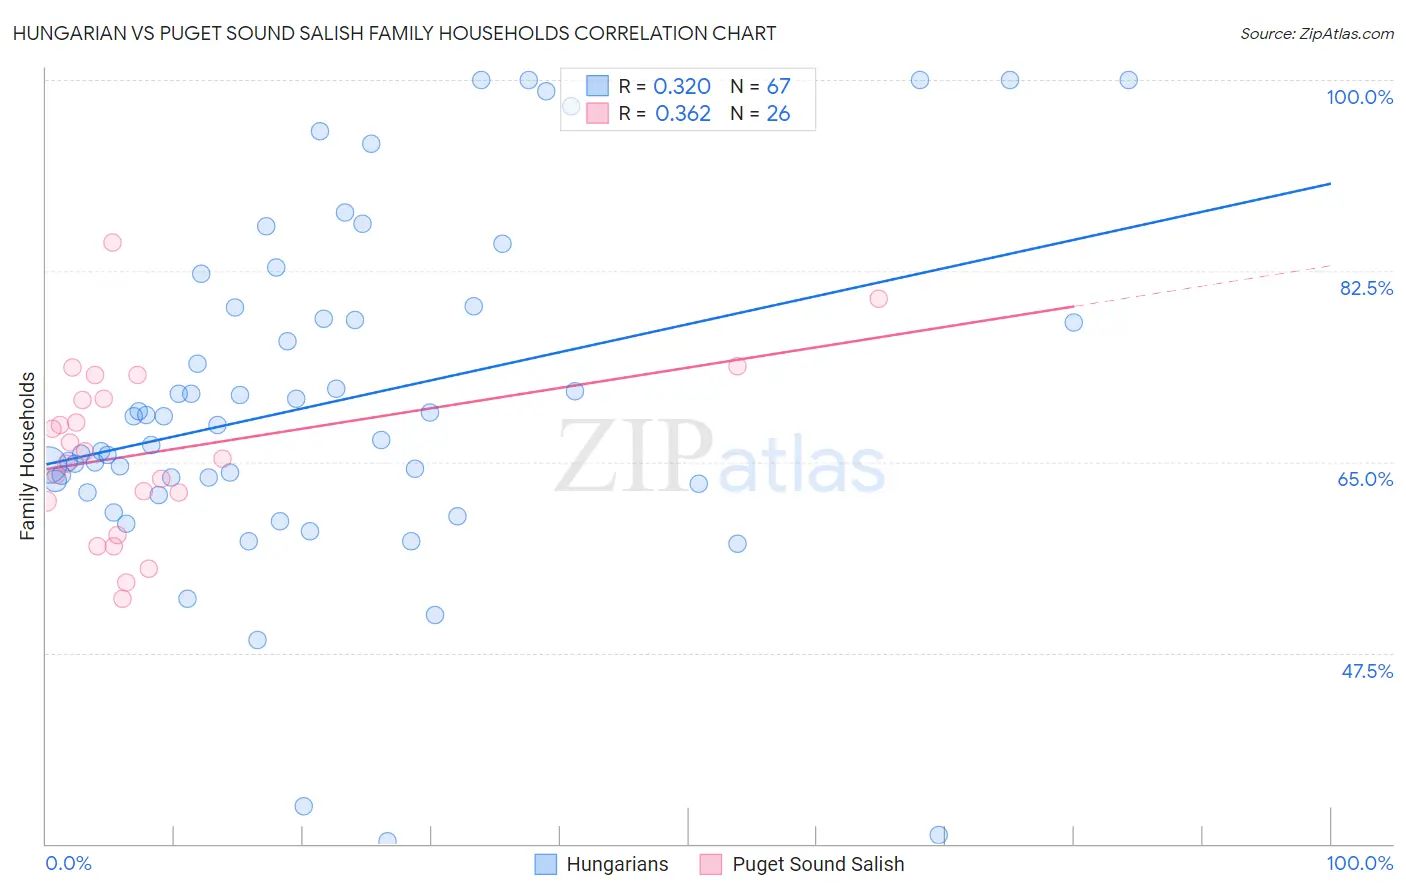
Hungarian vs Puget Sound Salish Family Households Correlation Chart
The statistical analysis conducted on geographies consisting of 485,906,921 people shows a mild positive correlation between the proportion of Hungarians and percentage of family households in the United States with a correlation coefficient (R) of 0.320 and weighted average of 64.9%. Similarly, the statistical analysis conducted on geographies consisting of 46,155,865 people shows a mild positive correlation between the proportion of Puget Sound Salish and percentage of family households in the United States with a correlation coefficient (R) of 0.362 and weighted average of 65.6%, a difference of 1.1%.
Family Households Correlation Summary
| Measurement | Hungarian | Puget Sound Salish |
| Minimum | 30.2% | 52.5% |
| Maximum | 100.0% | 85.1% |
| Range | 69.8% | 32.6% |
| Mean | 70.5% | 66.0% |
| Median | 68.4% | 65.6% |
| Interquartile 25% (IQ1) | 63.0% | 61.4% |
| Interquartile 75% (IQ3) | 79.1% | 70.8% |
| Interquartile Range (IQR) | 16.1% | 9.4% |
| Standard Deviation (Sample) | 15.7% | 7.9% |
| Standard Deviation (Population) | 15.6% | 7.7% |
Similar Demographics by Family Households
Demographics Similar to Hungarians by Family Households
In terms of family households, the demographic groups most similar to Hungarians are Immigrants from Oceania (64.9%, a difference of 0.010%), Immigrants from Eastern Asia (64.9%, a difference of 0.020%), Hmong (64.9%, a difference of 0.040%), Choctaw (64.9%, a difference of 0.040%), and Immigrants from Argentina (64.9%, a difference of 0.060%).
| Demographics | Rating | Rank | Family Households |
| Argentineans | 95.7 /100 | #114 | Exceptional 65.0% |
| Ecuadorians | 95.4 /100 | #115 | Exceptional 65.0% |
| Immigrants | Iraq | 95.4 /100 | #116 | Exceptional 65.0% |
| Cherokee | 95.3 /100 | #117 | Exceptional 65.0% |
| Dutch | 95.1 /100 | #118 | Exceptional 64.9% |
| Immigrants | Eastern Asia | 94.4 /100 | #119 | Exceptional 64.9% |
| Immigrants | Oceania | 94.2 /100 | #120 | Exceptional 64.9% |
| Hungarians | 94.0 /100 | #121 | Exceptional 64.9% |
| Hmong | 93.4 /100 | #122 | Exceptional 64.9% |
| Choctaw | 93.4 /100 | #123 | Exceptional 64.9% |
| Immigrants | Argentina | 92.8 /100 | #124 | Exceptional 64.9% |
| Immigrants | Belize | 92.7 /100 | #125 | Exceptional 64.9% |
| Panamanians | 92.4 /100 | #126 | Exceptional 64.8% |
| Immigrants | Panama | 92.0 /100 | #127 | Exceptional 64.8% |
| Italians | 91.9 /100 | #128 | Exceptional 64.8% |
Demographics Similar to Puget Sound Salish by Family Households
In terms of family households, the demographic groups most similar to Puget Sound Salish are Immigrants from Costa Rica (65.6%, a difference of 0.010%), Immigrants from South America (65.6%, a difference of 0.050%), Yaqui (65.6%, a difference of 0.050%), Immigrants from the Azores (65.6%, a difference of 0.060%), and Jordanian (65.5%, a difference of 0.080%).
| Demographics | Rating | Rank | Family Households |
| Laotians | 99.9 /100 | #73 | Exceptional 65.8% |
| Burmese | 99.9 /100 | #74 | Exceptional 65.7% |
| Houma | 99.9 /100 | #75 | Exceptional 65.7% |
| Immigrants | Azores | 99.8 /100 | #76 | Exceptional 65.6% |
| Immigrants | South America | 99.8 /100 | #77 | Exceptional 65.6% |
| Yaqui | 99.8 /100 | #78 | Exceptional 65.6% |
| Immigrants | Costa Rica | 99.8 /100 | #79 | Exceptional 65.6% |
| Puget Sound Salish | 99.8 /100 | #80 | Exceptional 65.6% |
| Jordanians | 99.7 /100 | #81 | Exceptional 65.5% |
| Immigrants | Lebanon | 99.7 /100 | #82 | Exceptional 65.5% |
| Immigrants | Guyana | 99.6 /100 | #83 | Exceptional 65.5% |
| Americans | 99.6 /100 | #84 | Exceptional 65.5% |
| Immigrants | Cambodia | 99.5 /100 | #85 | Exceptional 65.4% |
| Egyptians | 99.4 /100 | #86 | Exceptional 65.4% |
| Immigrants | Egypt | 99.2 /100 | #87 | Exceptional 65.3% |