Malaysian vs Puget Sound Salish Unemployment Among Seniors over 65 years
COMPARE
Malaysian
Puget Sound Salish
Unemployment Among Seniors over 65 years
Unemployment Among Seniors over 65 years Comparison
Malaysians
Puget Sound Salish
5.1%
UNEMPLOYMENT AMONG SENIORS OVER 65 YEARS
90.4/ 100
METRIC RATING
117th/ 347
METRIC RANK
5.1%
UNEMPLOYMENT AMONG SENIORS OVER 65 YEARS
88.7/ 100
METRIC RATING
121st/ 347
METRIC RANK
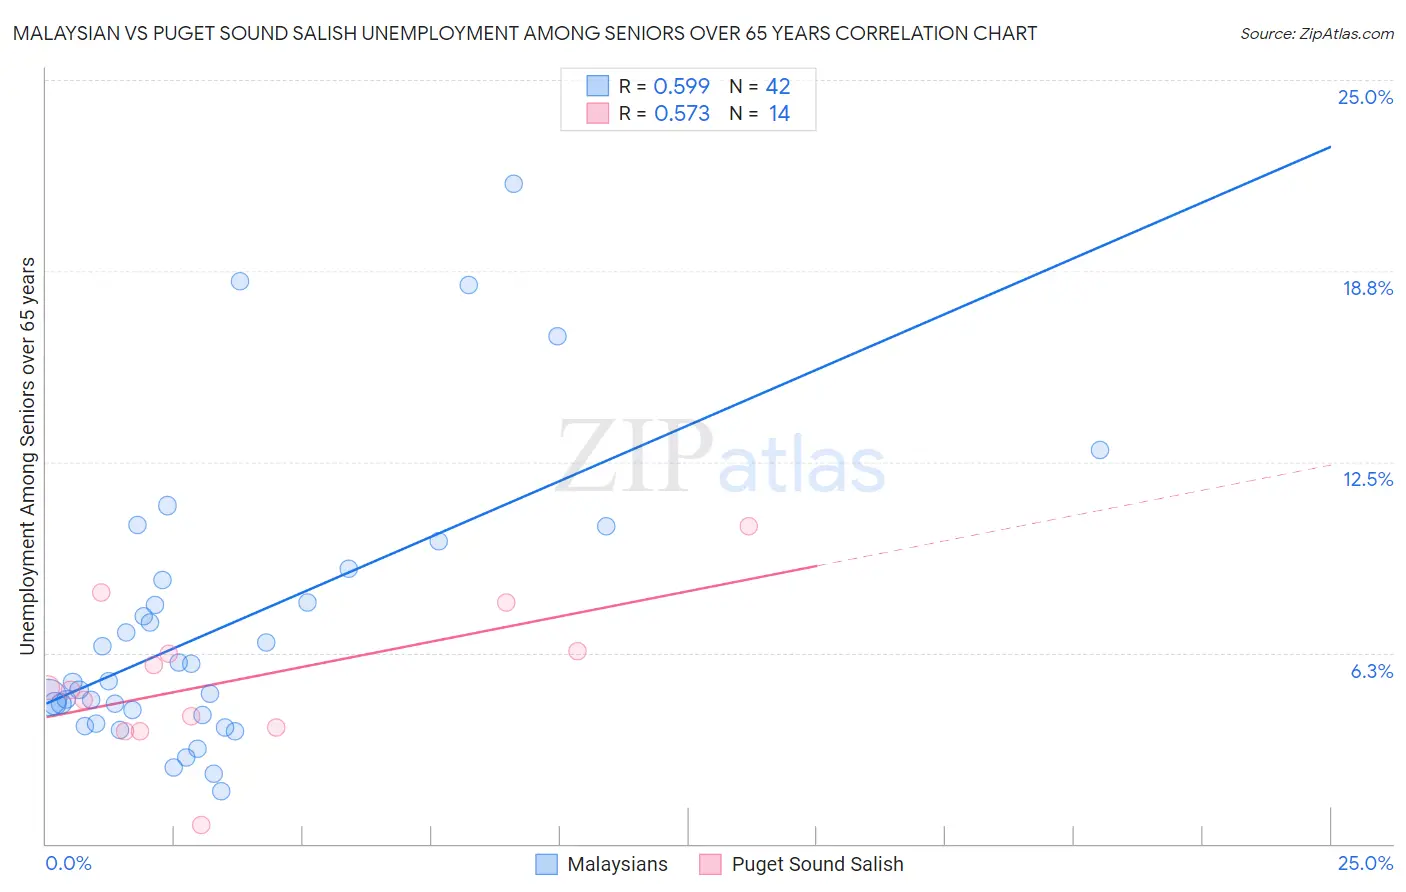
Malaysian vs Puget Sound Salish Unemployment Among Seniors over 65 years Correlation Chart
The statistical analysis conducted on geographies consisting of 210,872,755 people shows a substantial positive correlation between the proportion of Malaysians and unemployment rate amomg seniors over the age of 65 in the United States with a correlation coefficient (R) of 0.599 and weighted average of 5.1%. Similarly, the statistical analysis conducted on geographies consisting of 43,658,103 people shows a substantial positive correlation between the proportion of Puget Sound Salish and unemployment rate amomg seniors over the age of 65 in the United States with a correlation coefficient (R) of 0.573 and weighted average of 5.1%, a difference of 0.15%.
Unemployment Among Seniors over 65 years Correlation Summary
| Measurement | Malaysian | Puget Sound Salish |
| Minimum | 1.7% | 0.60% |
| Maximum | 21.6% | 10.4% |
| Range | 19.9% | 9.8% |
| Mean | 7.1% | 5.4% |
| Median | 5.3% | 5.1% |
| Interquartile 25% (IQ1) | 4.2% | 3.8% |
| Interquartile 75% (IQ3) | 8.6% | 6.3% |
| Interquartile Range (IQR) | 4.4% | 2.5% |
| Standard Deviation (Sample) | 4.6% | 2.4% |
| Standard Deviation (Population) | 4.6% | 2.3% |
Demographics Similar to Malaysians and Puget Sound Salish by Unemployment Among Seniors over 65 years
In terms of unemployment among seniors over 65 years, the demographic groups most similar to Malaysians are Soviet Union (5.1%, a difference of 0.030%), Immigrants from Korea (5.0%, a difference of 0.060%), Immigrants from Canada (5.1%, a difference of 0.070%), Immigrants from Latvia (5.0%, a difference of 0.090%), and Celtic (5.0%, a difference of 0.090%). Similarly, the demographic groups most similar to Puget Sound Salish are Irish (5.1%, a difference of 0.010%), Immigrants from Cameroon (5.1%, a difference of 0.010%), Asian (5.1%, a difference of 0.010%), Immigrants from North America (5.1%, a difference of 0.060%), and Dutch (5.1%, a difference of 0.080%).
| Demographics | Rating | Rank | Unemployment Among Seniors over 65 years |
| Immigrants | Malaysia | 92.7 /100 | #109 | Exceptional 5.0% |
| Immigrants | Saudi Arabia | 92.7 /100 | #110 | Exceptional 5.0% |
| Finns | 92.2 /100 | #111 | Exceptional 5.0% |
| Eastern Europeans | 92.0 /100 | #112 | Exceptional 5.0% |
| Seminole | 91.4 /100 | #113 | Exceptional 5.0% |
| Immigrants | Latvia | 91.4 /100 | #114 | Exceptional 5.0% |
| Celtics | 91.3 /100 | #115 | Exceptional 5.0% |
| Immigrants | Korea | 91.0 /100 | #116 | Exceptional 5.0% |
| Malaysians | 90.4 /100 | #117 | Exceptional 5.1% |
| Soviet Union | 90.1 /100 | #118 | Exceptional 5.1% |
| Immigrants | Canada | 89.7 /100 | #119 | Excellent 5.1% |
| Irish | 88.8 /100 | #120 | Excellent 5.1% |
| Puget Sound Salish | 88.7 /100 | #121 | Excellent 5.1% |
| Immigrants | Cameroon | 88.6 /100 | #122 | Excellent 5.1% |
| Asians | 88.5 /100 | #123 | Excellent 5.1% |
| Immigrants | North America | 87.9 /100 | #124 | Excellent 5.1% |
| Dutch | 87.6 /100 | #125 | Excellent 5.1% |
| Immigrants | Sri Lanka | 87.4 /100 | #126 | Excellent 5.1% |
| Sri Lankans | 87.4 /100 | #127 | Excellent 5.1% |
| Australians | 87.1 /100 | #128 | Excellent 5.1% |
| Immigrants | England | 86.7 /100 | #129 | Excellent 5.1% |