Indonesian vs Puget Sound Salish Family Households
COMPARE
Indonesian
Puget Sound Salish
Family Households
Family Households Comparison
Indonesians
Puget Sound Salish
61.5%
FAMILY HOUSEHOLDS
0.0/ 100
METRIC RATING
326th/ 347
METRIC RANK
65.6%
FAMILY HOUSEHOLDS
99.8/ 100
METRIC RATING
80th/ 347
METRIC RANK
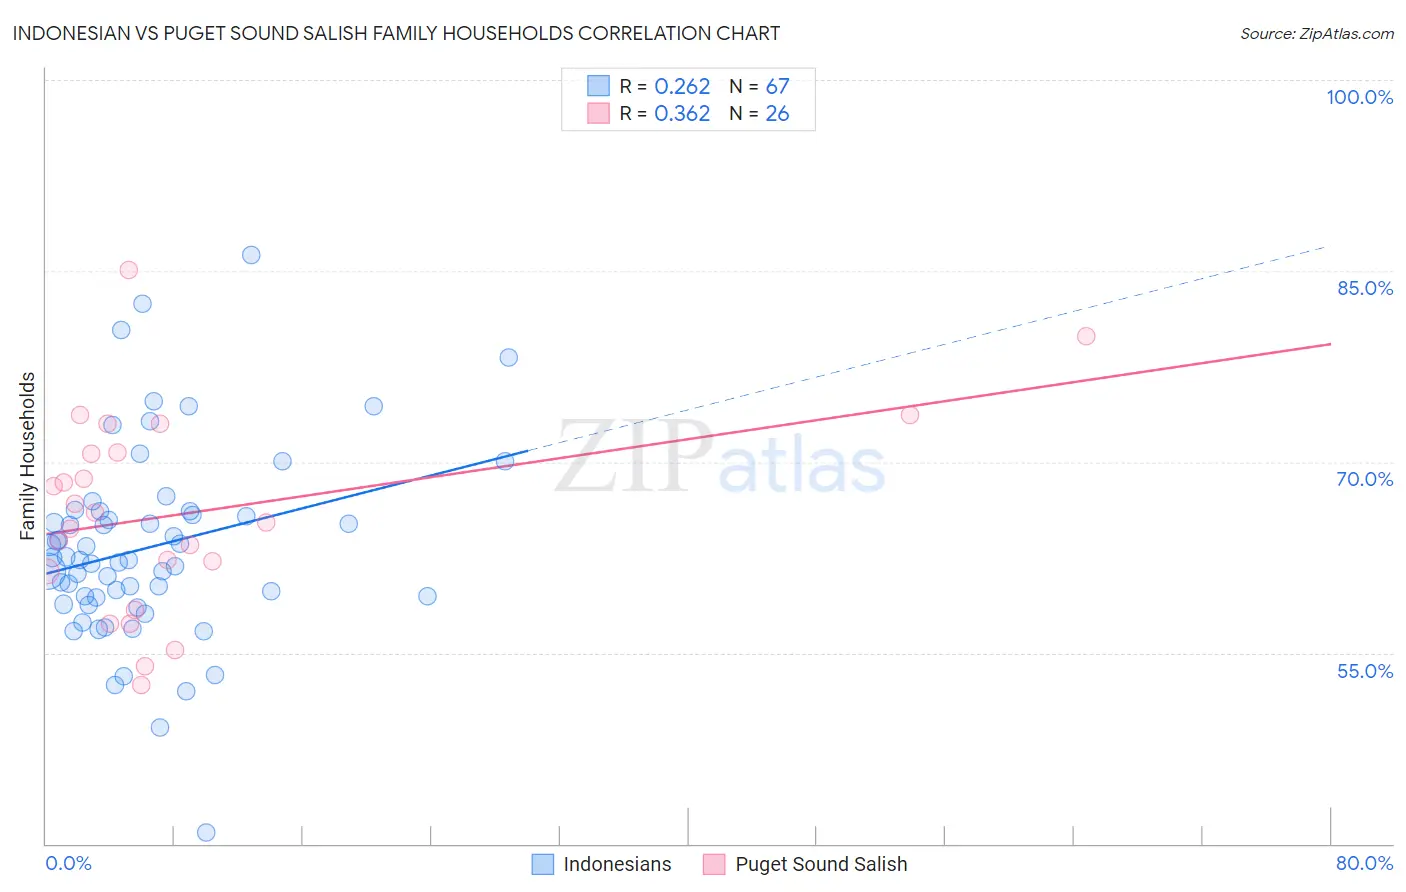
Indonesian vs Puget Sound Salish Family Households Correlation Chart
The statistical analysis conducted on geographies consisting of 162,647,758 people shows a weak positive correlation between the proportion of Indonesians and percentage of family households in the United States with a correlation coefficient (R) of 0.262 and weighted average of 61.5%. Similarly, the statistical analysis conducted on geographies consisting of 46,155,865 people shows a mild positive correlation between the proportion of Puget Sound Salish and percentage of family households in the United States with a correlation coefficient (R) of 0.362 and weighted average of 65.6%, a difference of 6.7%.
Family Households Correlation Summary
| Measurement | Indonesian | Puget Sound Salish |
| Minimum | 40.9% | 52.5% |
| Maximum | 86.2% | 85.1% |
| Range | 45.3% | 32.6% |
| Mean | 63.3% | 66.0% |
| Median | 62.3% | 65.6% |
| Interquartile 25% (IQ1) | 59.4% | 61.4% |
| Interquartile 75% (IQ3) | 66.1% | 70.8% |
| Interquartile Range (IQR) | 6.7% | 9.4% |
| Standard Deviation (Sample) | 7.6% | 7.9% |
| Standard Deviation (Population) | 7.6% | 7.7% |
Similar Demographics by Family Households
Demographics Similar to Indonesians by Family Households
In terms of family households, the demographic groups most similar to Indonesians are Black/African American (61.5%, a difference of 0.020%), Kiowa (61.4%, a difference of 0.15%), Cambodian (61.4%, a difference of 0.18%), Immigrants from Switzerland (61.6%, a difference of 0.19%), and Immigrants from West Indies (61.6%, a difference of 0.20%).
| Demographics | Rating | Rank | Family Households |
| Cape Verdeans | 0.0 /100 | #319 | Tragic 61.8% |
| Ugandans | 0.0 /100 | #320 | Tragic 61.7% |
| Alsatians | 0.0 /100 | #321 | Tragic 61.7% |
| Immigrants | Serbia | 0.0 /100 | #322 | Tragic 61.6% |
| Tlingit-Haida | 0.0 /100 | #323 | Tragic 61.6% |
| Immigrants | West Indies | 0.0 /100 | #324 | Tragic 61.6% |
| Immigrants | Switzerland | 0.0 /100 | #325 | Tragic 61.6% |
| Indonesians | 0.0 /100 | #326 | Tragic 61.5% |
| Blacks/African Americans | 0.0 /100 | #327 | Tragic 61.5% |
| Kiowa | 0.0 /100 | #328 | Tragic 61.4% |
| Cambodians | 0.0 /100 | #329 | Tragic 61.4% |
| Immigrants | Australia | 0.0 /100 | #330 | Tragic 61.3% |
| Immigrants | France | 0.0 /100 | #331 | Tragic 61.3% |
| Ethiopians | 0.0 /100 | #332 | Tragic 61.2% |
| Immigrants | Ethiopia | 0.0 /100 | #333 | Tragic 61.2% |
Demographics Similar to Puget Sound Salish by Family Households
In terms of family households, the demographic groups most similar to Puget Sound Salish are Immigrants from Costa Rica (65.6%, a difference of 0.010%), Immigrants from South America (65.6%, a difference of 0.050%), Yaqui (65.6%, a difference of 0.050%), Immigrants from the Azores (65.6%, a difference of 0.060%), and Jordanian (65.5%, a difference of 0.080%).
| Demographics | Rating | Rank | Family Households |
| Laotians | 99.9 /100 | #73 | Exceptional 65.8% |
| Burmese | 99.9 /100 | #74 | Exceptional 65.7% |
| Houma | 99.9 /100 | #75 | Exceptional 65.7% |
| Immigrants | Azores | 99.8 /100 | #76 | Exceptional 65.6% |
| Immigrants | South America | 99.8 /100 | #77 | Exceptional 65.6% |
| Yaqui | 99.8 /100 | #78 | Exceptional 65.6% |
| Immigrants | Costa Rica | 99.8 /100 | #79 | Exceptional 65.6% |
| Puget Sound Salish | 99.8 /100 | #80 | Exceptional 65.6% |
| Jordanians | 99.7 /100 | #81 | Exceptional 65.5% |
| Immigrants | Lebanon | 99.7 /100 | #82 | Exceptional 65.5% |
| Immigrants | Guyana | 99.6 /100 | #83 | Exceptional 65.5% |
| Americans | 99.6 /100 | #84 | Exceptional 65.5% |
| Immigrants | Cambodia | 99.5 /100 | #85 | Exceptional 65.4% |
| Egyptians | 99.4 /100 | #86 | Exceptional 65.4% |
| Immigrants | Egypt | 99.2 /100 | #87 | Exceptional 65.3% |