Malaysian vs Danish Family Households
COMPARE
Malaysian
Danish
Family Households
Family Households Comparison
Malaysians
Danes
65.9%
FAMILY HOUSEHOLDS
99.9/ 100
METRIC RATING
69th/ 347
METRIC RANK
66.0%
FAMILY HOUSEHOLDS
100.0/ 100
METRIC RATING
61st/ 347
METRIC RANK
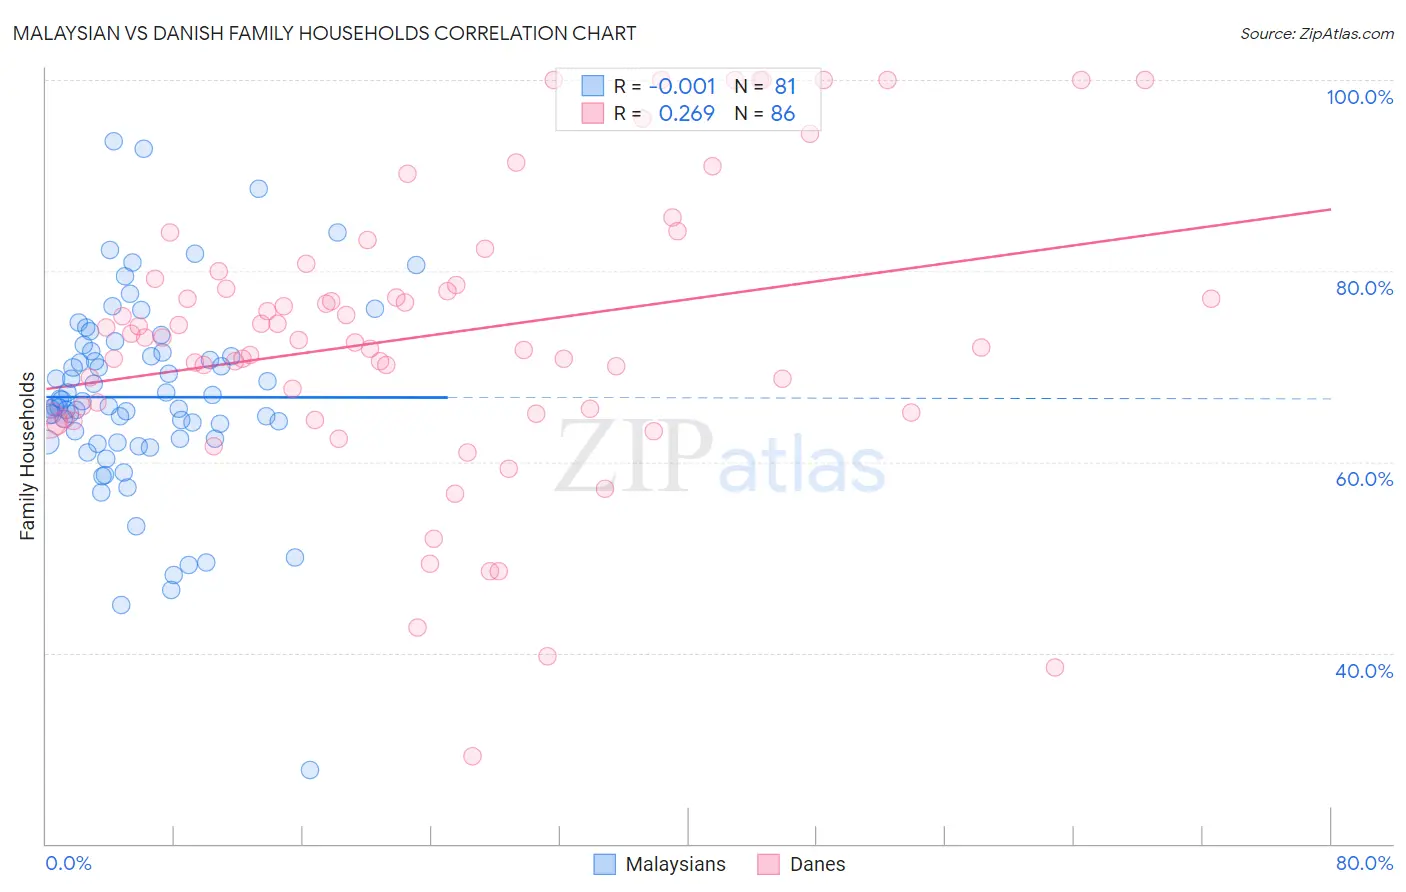
Malaysian vs Danish Family Households Correlation Chart
The statistical analysis conducted on geographies consisting of 226,012,303 people shows no correlation between the proportion of Malaysians and percentage of family households in the United States with a correlation coefficient (R) of -0.001 and weighted average of 65.9%. Similarly, the statistical analysis conducted on geographies consisting of 473,910,388 people shows a weak positive correlation between the proportion of Danes and percentage of family households in the United States with a correlation coefficient (R) of 0.269 and weighted average of 66.0%, a difference of 0.23%.
Family Households Correlation Summary
| Measurement | Malaysian | Danish |
| Minimum | 27.8% | 29.2% |
| Maximum | 93.6% | 100.0% |
| Range | 65.8% | 70.8% |
| Mean | 66.8% | 73.3% |
| Median | 65.9% | 72.9% |
| Interquartile 25% (IQ1) | 62.2% | 65.2% |
| Interquartile 75% (IQ3) | 71.5% | 79.2% |
| Interquartile Range (IQR) | 9.3% | 14.0% |
| Standard Deviation (Sample) | 10.3% | 14.9% |
| Standard Deviation (Population) | 10.3% | 14.8% |
Demographics Similar to Malaysians and Danes by Family Households
In terms of family households, the demographic groups most similar to Malaysians are Immigrants from Afghanistan (65.9%, a difference of 0.010%), Bhutanese (65.9%, a difference of 0.020%), Japanese (65.9%, a difference of 0.030%), Fijian (65.9%, a difference of 0.050%), and Filipino (65.9%, a difference of 0.050%). Similarly, the demographic groups most similar to Danes are South American (66.0%, a difference of 0.020%), Immigrants from Korea (66.0%, a difference of 0.030%), Central American (66.0%, a difference of 0.030%), Immigrants from Asia (66.1%, a difference of 0.050%), and Immigrants from Indonesia (66.0%, a difference of 0.070%).
| Demographics | Rating | Rank | Family Households |
| Immigrants | Immigrants | 100.0 /100 | #55 | Exceptional 66.1% |
| Immigrants | Hong Kong | 100.0 /100 | #56 | Exceptional 66.1% |
| Pennsylvania Germans | 100.0 /100 | #57 | Exceptional 66.1% |
| Immigrants | Asia | 100.0 /100 | #58 | Exceptional 66.1% |
| Immigrants | Korea | 100.0 /100 | #59 | Exceptional 66.0% |
| South Americans | 100.0 /100 | #60 | Exceptional 66.0% |
| Danes | 100.0 /100 | #61 | Exceptional 66.0% |
| Central Americans | 100.0 /100 | #62 | Exceptional 66.0% |
| Immigrants | Indonesia | 100.0 /100 | #63 | Exceptional 66.0% |
| Pima | 99.9 /100 | #64 | Exceptional 65.9% |
| Costa Ricans | 99.9 /100 | #65 | Exceptional 65.9% |
| Fijians | 99.9 /100 | #66 | Exceptional 65.9% |
| Filipinos | 99.9 /100 | #67 | Exceptional 65.9% |
| Japanese | 99.9 /100 | #68 | Exceptional 65.9% |
| Malaysians | 99.9 /100 | #69 | Exceptional 65.9% |
| Immigrants | Afghanistan | 99.9 /100 | #70 | Exceptional 65.9% |
| Bhutanese | 99.9 /100 | #71 | Exceptional 65.9% |
| Portuguese | 99.9 /100 | #72 | Exceptional 65.8% |
| Laotians | 99.9 /100 | #73 | Exceptional 65.8% |
| Burmese | 99.9 /100 | #74 | Exceptional 65.7% |
| Houma | 99.9 /100 | #75 | Exceptional 65.7% |