Ottawa vs Puget Sound Salish Family Households
COMPARE
Ottawa
Puget Sound Salish
Family Households
Family Households Comparison
Ottawa
Puget Sound Salish
63.0%
FAMILY HOUSEHOLDS
0.3/ 100
METRIC RATING
277th/ 347
METRIC RANK
65.6%
FAMILY HOUSEHOLDS
99.8/ 100
METRIC RATING
80th/ 347
METRIC RANK
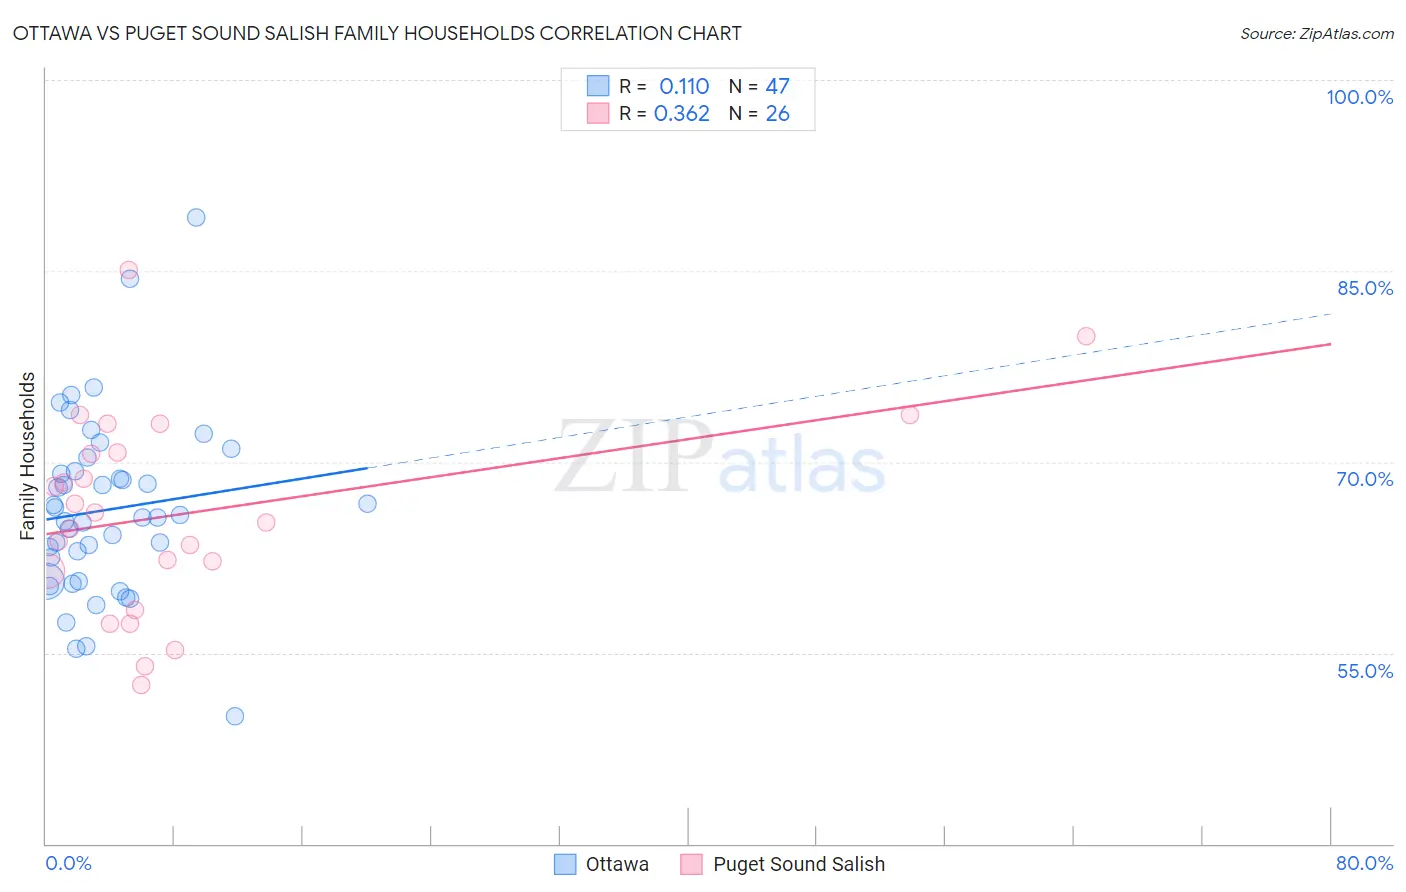
Ottawa vs Puget Sound Salish Family Households Correlation Chart
The statistical analysis conducted on geographies consisting of 49,944,420 people shows a poor positive correlation between the proportion of Ottawa and percentage of family households in the United States with a correlation coefficient (R) of 0.110 and weighted average of 63.0%. Similarly, the statistical analysis conducted on geographies consisting of 46,155,865 people shows a mild positive correlation between the proportion of Puget Sound Salish and percentage of family households in the United States with a correlation coefficient (R) of 0.362 and weighted average of 65.6%, a difference of 4.1%.
Family Households Correlation Summary
| Measurement | Ottawa | Puget Sound Salish |
| Minimum | 50.0% | 52.5% |
| Maximum | 89.2% | 85.1% |
| Range | 39.2% | 32.6% |
| Mean | 66.2% | 66.0% |
| Median | 65.7% | 65.6% |
| Interquartile 25% (IQ1) | 60.7% | 61.4% |
| Interquartile 75% (IQ3) | 69.2% | 70.8% |
| Interquartile Range (IQR) | 8.6% | 9.4% |
| Standard Deviation (Sample) | 7.1% | 7.9% |
| Standard Deviation (Population) | 7.0% | 7.7% |
Similar Demographics by Family Households
Demographics Similar to Ottawa by Family Households
In terms of family households, the demographic groups most similar to Ottawa are Immigrants from Belgium (63.0%, a difference of 0.040%), Serbian (63.0%, a difference of 0.050%), Lumbee (63.1%, a difference of 0.070%), West Indian (63.1%, a difference of 0.070%), and Immigrants from Kazakhstan (63.1%, a difference of 0.080%).
| Demographics | Rating | Rank | Family Households |
| Immigrants | Austria | 0.3 /100 | #270 | Tragic 63.1% |
| Immigrants | Croatia | 0.3 /100 | #271 | Tragic 63.1% |
| Immigrants | Turkey | 0.3 /100 | #272 | Tragic 63.1% |
| Immigrants | Kazakhstan | 0.3 /100 | #273 | Tragic 63.1% |
| Lumbee | 0.3 /100 | #274 | Tragic 63.1% |
| West Indians | 0.3 /100 | #275 | Tragic 63.1% |
| Serbians | 0.3 /100 | #276 | Tragic 63.0% |
| Ottawa | 0.3 /100 | #277 | Tragic 63.0% |
| Immigrants | Belgium | 0.2 /100 | #278 | Tragic 63.0% |
| Immigrants | Yemen | 0.2 /100 | #279 | Tragic 63.0% |
| Immigrants | Bulgaria | 0.2 /100 | #280 | Tragic 63.0% |
| Estonians | 0.2 /100 | #281 | Tragic 62.9% |
| New Zealanders | 0.1 /100 | #282 | Tragic 62.9% |
| Immigrants | Denmark | 0.1 /100 | #283 | Tragic 62.9% |
| Australians | 0.1 /100 | #284 | Tragic 62.8% |
Demographics Similar to Puget Sound Salish by Family Households
In terms of family households, the demographic groups most similar to Puget Sound Salish are Immigrants from Costa Rica (65.6%, a difference of 0.010%), Immigrants from South America (65.6%, a difference of 0.050%), Yaqui (65.6%, a difference of 0.050%), Immigrants from the Azores (65.6%, a difference of 0.060%), and Jordanian (65.5%, a difference of 0.080%).
| Demographics | Rating | Rank | Family Households |
| Laotians | 99.9 /100 | #73 | Exceptional 65.8% |
| Burmese | 99.9 /100 | #74 | Exceptional 65.7% |
| Houma | 99.9 /100 | #75 | Exceptional 65.7% |
| Immigrants | Azores | 99.8 /100 | #76 | Exceptional 65.6% |
| Immigrants | South America | 99.8 /100 | #77 | Exceptional 65.6% |
| Yaqui | 99.8 /100 | #78 | Exceptional 65.6% |
| Immigrants | Costa Rica | 99.8 /100 | #79 | Exceptional 65.6% |
| Puget Sound Salish | 99.8 /100 | #80 | Exceptional 65.6% |
| Jordanians | 99.7 /100 | #81 | Exceptional 65.5% |
| Immigrants | Lebanon | 99.7 /100 | #82 | Exceptional 65.5% |
| Immigrants | Guyana | 99.6 /100 | #83 | Exceptional 65.5% |
| Americans | 99.6 /100 | #84 | Exceptional 65.5% |
| Immigrants | Cambodia | 99.5 /100 | #85 | Exceptional 65.4% |
| Egyptians | 99.4 /100 | #86 | Exceptional 65.4% |
| Immigrants | Egypt | 99.2 /100 | #87 | Exceptional 65.3% |