Malaysian vs Indonesian Family Households
COMPARE
Malaysian
Indonesian
Family Households
Family Households Comparison
Malaysians
Indonesians
65.9%
FAMILY HOUSEHOLDS
99.9/ 100
METRIC RATING
69th/ 347
METRIC RANK
61.5%
FAMILY HOUSEHOLDS
0.0/ 100
METRIC RATING
326th/ 347
METRIC RANK
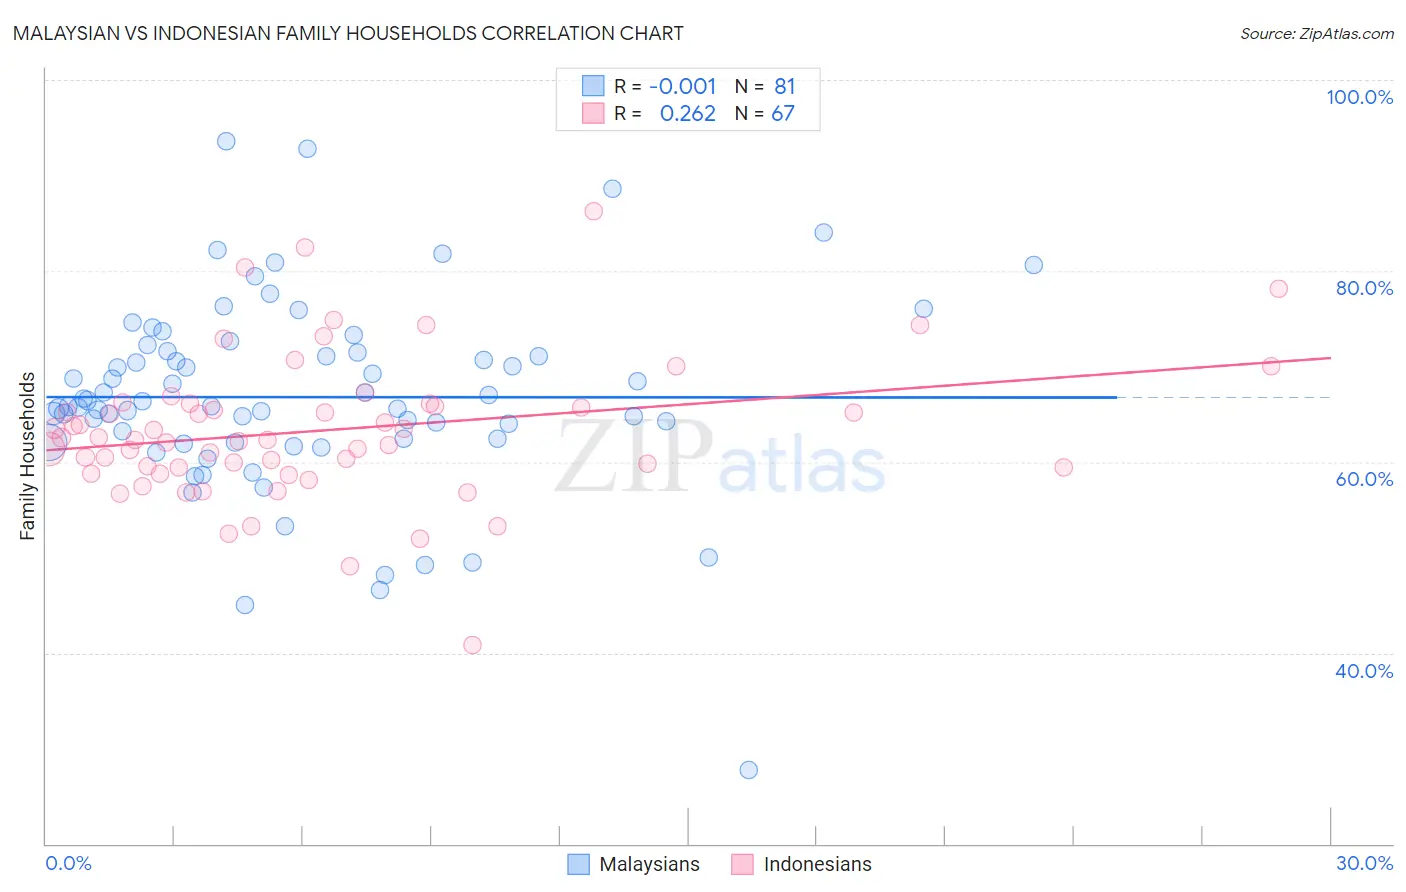
Malaysian vs Indonesian Family Households Correlation Chart
The statistical analysis conducted on geographies consisting of 226,012,303 people shows no correlation between the proportion of Malaysians and percentage of family households in the United States with a correlation coefficient (R) of -0.001 and weighted average of 65.9%. Similarly, the statistical analysis conducted on geographies consisting of 162,647,758 people shows a weak positive correlation between the proportion of Indonesians and percentage of family households in the United States with a correlation coefficient (R) of 0.262 and weighted average of 61.5%, a difference of 7.1%.
Family Households Correlation Summary
| Measurement | Malaysian | Indonesian |
| Minimum | 27.8% | 40.9% |
| Maximum | 93.6% | 86.2% |
| Range | 65.8% | 45.3% |
| Mean | 66.8% | 63.3% |
| Median | 65.9% | 62.3% |
| Interquartile 25% (IQ1) | 62.2% | 59.4% |
| Interquartile 75% (IQ3) | 71.5% | 66.1% |
| Interquartile Range (IQR) | 9.3% | 6.7% |
| Standard Deviation (Sample) | 10.3% | 7.6% |
| Standard Deviation (Population) | 10.3% | 7.6% |
Similar Demographics by Family Households
Demographics Similar to Malaysians by Family Households
In terms of family households, the demographic groups most similar to Malaysians are Immigrants from Afghanistan (65.9%, a difference of 0.010%), Bhutanese (65.9%, a difference of 0.020%), Japanese (65.9%, a difference of 0.030%), Fijian (65.9%, a difference of 0.050%), and Filipino (65.9%, a difference of 0.050%).
| Demographics | Rating | Rank | Family Households |
| Central Americans | 100.0 /100 | #62 | Exceptional 66.0% |
| Immigrants | Indonesia | 100.0 /100 | #63 | Exceptional 66.0% |
| Pima | 99.9 /100 | #64 | Exceptional 65.9% |
| Costa Ricans | 99.9 /100 | #65 | Exceptional 65.9% |
| Fijians | 99.9 /100 | #66 | Exceptional 65.9% |
| Filipinos | 99.9 /100 | #67 | Exceptional 65.9% |
| Japanese | 99.9 /100 | #68 | Exceptional 65.9% |
| Malaysians | 99.9 /100 | #69 | Exceptional 65.9% |
| Immigrants | Afghanistan | 99.9 /100 | #70 | Exceptional 65.9% |
| Bhutanese | 99.9 /100 | #71 | Exceptional 65.9% |
| Portuguese | 99.9 /100 | #72 | Exceptional 65.8% |
| Laotians | 99.9 /100 | #73 | Exceptional 65.8% |
| Burmese | 99.9 /100 | #74 | Exceptional 65.7% |
| Houma | 99.9 /100 | #75 | Exceptional 65.7% |
| Immigrants | Azores | 99.8 /100 | #76 | Exceptional 65.6% |
Demographics Similar to Indonesians by Family Households
In terms of family households, the demographic groups most similar to Indonesians are Black/African American (61.5%, a difference of 0.020%), Kiowa (61.4%, a difference of 0.15%), Cambodian (61.4%, a difference of 0.18%), Immigrants from Switzerland (61.6%, a difference of 0.19%), and Immigrants from West Indies (61.6%, a difference of 0.20%).
| Demographics | Rating | Rank | Family Households |
| Cape Verdeans | 0.0 /100 | #319 | Tragic 61.8% |
| Ugandans | 0.0 /100 | #320 | Tragic 61.7% |
| Alsatians | 0.0 /100 | #321 | Tragic 61.7% |
| Immigrants | Serbia | 0.0 /100 | #322 | Tragic 61.6% |
| Tlingit-Haida | 0.0 /100 | #323 | Tragic 61.6% |
| Immigrants | West Indies | 0.0 /100 | #324 | Tragic 61.6% |
| Immigrants | Switzerland | 0.0 /100 | #325 | Tragic 61.6% |
| Indonesians | 0.0 /100 | #326 | Tragic 61.5% |
| Blacks/African Americans | 0.0 /100 | #327 | Tragic 61.5% |
| Kiowa | 0.0 /100 | #328 | Tragic 61.4% |
| Cambodians | 0.0 /100 | #329 | Tragic 61.4% |
| Immigrants | Australia | 0.0 /100 | #330 | Tragic 61.3% |
| Immigrants | France | 0.0 /100 | #331 | Tragic 61.3% |
| Ethiopians | 0.0 /100 | #332 | Tragic 61.2% |
| Immigrants | Ethiopia | 0.0 /100 | #333 | Tragic 61.2% |