Iroquois vs Trinidadian and Tobagonian Married-couple Households
COMPARE
Iroquois
Trinidadian and Tobagonian
Married-couple Households
Married-couple Households Comparison
Iroquois
Trinidadians and Tobagonians
43.7%
MARRIED-COUPLE HOUSEHOLDS
0.2/ 100
METRIC RATING
259th/ 347
METRIC RANK
40.9%
MARRIED-COUPLE HOUSEHOLDS
0.0/ 100
METRIC RATING
315th/ 347
METRIC RANK
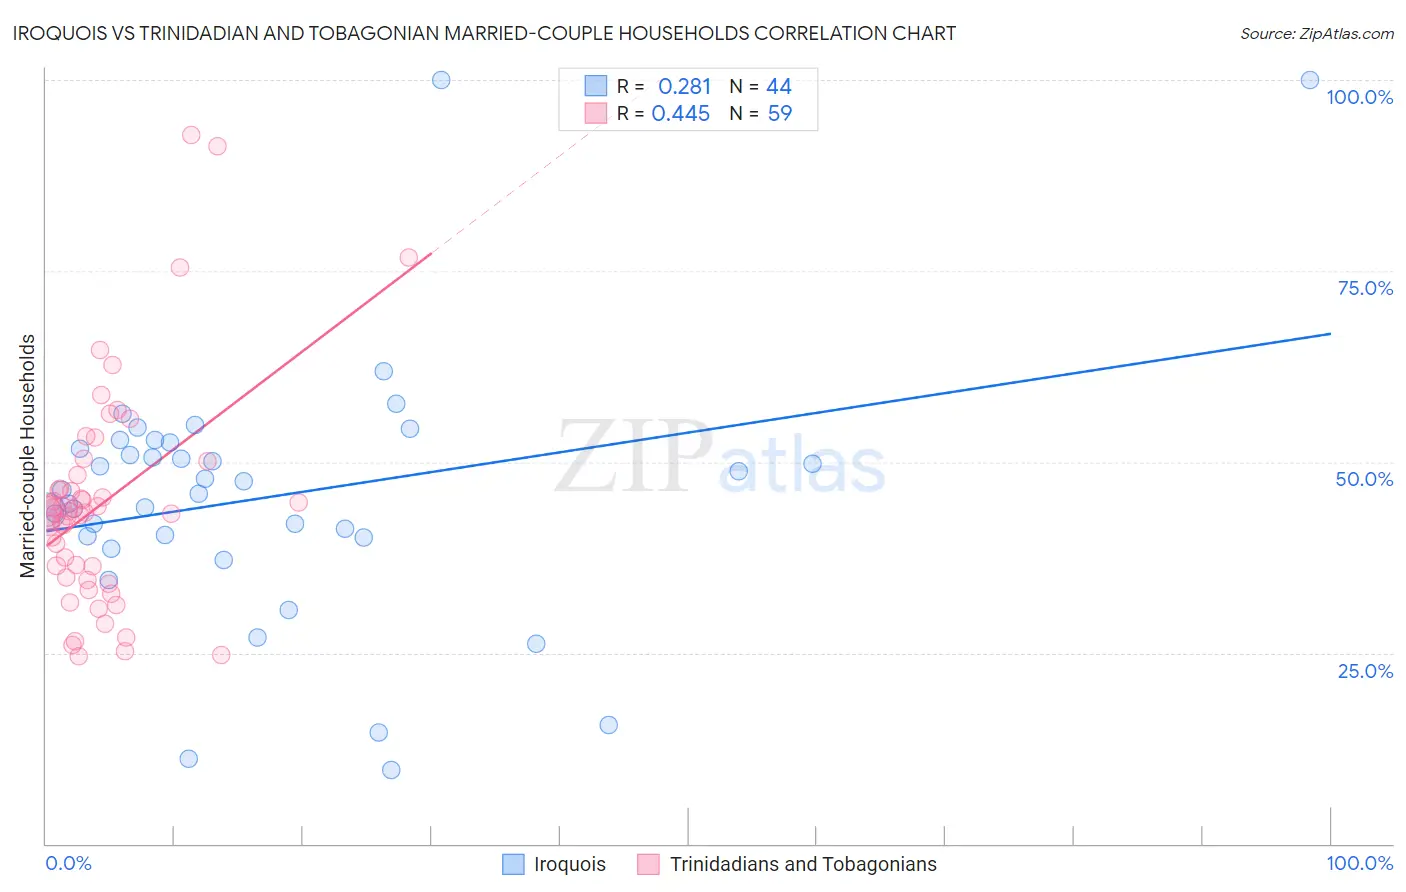
Iroquois vs Trinidadian and Tobagonian Married-couple Households Correlation Chart
The statistical analysis conducted on geographies consisting of 207,249,804 people shows a weak positive correlation between the proportion of Iroquois and percentage of married-couple family households in the United States with a correlation coefficient (R) of 0.281 and weighted average of 43.7%. Similarly, the statistical analysis conducted on geographies consisting of 219,710,717 people shows a moderate positive correlation between the proportion of Trinidadians and Tobagonians and percentage of married-couple family households in the United States with a correlation coefficient (R) of 0.445 and weighted average of 40.9%, a difference of 7.1%.
Married-couple Households Correlation Summary
| Measurement | Iroquois | Trinidadian and Tobagonian |
| Minimum | 9.6% | 24.5% |
| Maximum | 100.0% | 92.8% |
| Range | 90.4% | 68.3% |
| Mean | 45.4% | 44.6% |
| Median | 46.1% | 43.5% |
| Interquartile 25% (IQ1) | 40.2% | 34.9% |
| Interquartile 75% (IQ3) | 52.1% | 48.2% |
| Interquartile Range (IQR) | 12.0% | 13.3% |
| Standard Deviation (Sample) | 17.2% | 14.3% |
| Standard Deviation (Population) | 17.0% | 14.2% |
Similar Demographics by Married-couple Households
Demographics Similar to Iroquois by Married-couple Households
In terms of married-couple households, the demographic groups most similar to Iroquois are Central American Indian (43.8%, a difference of 0.030%), Blackfeet (43.8%, a difference of 0.070%), Immigrants from Cameroon (43.7%, a difference of 0.090%), Alaskan Athabascan (43.6%, a difference of 0.22%), and Ugandan (43.8%, a difference of 0.23%).
| Demographics | Rating | Rank | Married-couple Households |
| Seminole | 0.4 /100 | #252 | Tragic 44.0% |
| Central Americans | 0.3 /100 | #253 | Tragic 43.9% |
| Apache | 0.3 /100 | #254 | Tragic 43.9% |
| Shoshone | 0.3 /100 | #255 | Tragic 43.9% |
| Ugandans | 0.3 /100 | #256 | Tragic 43.8% |
| Blackfeet | 0.2 /100 | #257 | Tragic 43.8% |
| Central American Indians | 0.2 /100 | #258 | Tragic 43.8% |
| Iroquois | 0.2 /100 | #259 | Tragic 43.7% |
| Immigrants | Cameroon | 0.2 /100 | #260 | Tragic 43.7% |
| Alaskan Athabascans | 0.2 /100 | #261 | Tragic 43.6% |
| Vietnamese | 0.2 /100 | #262 | Tragic 43.6% |
| Cree | 0.1 /100 | #263 | Tragic 43.6% |
| Bangladeshis | 0.1 /100 | #264 | Tragic 43.5% |
| Moroccans | 0.1 /100 | #265 | Tragic 43.5% |
| Ecuadorians | 0.1 /100 | #266 | Tragic 43.5% |
Demographics Similar to Trinidadians and Tobagonians by Married-couple Households
In terms of married-couple households, the demographic groups most similar to Trinidadians and Tobagonians are Jamaican (40.9%, a difference of 0.080%), Immigrants from Haiti (40.9%, a difference of 0.15%), Immigrants from Caribbean (40.8%, a difference of 0.18%), African (40.9%, a difference of 0.22%), and Colville (41.0%, a difference of 0.30%).
| Demographics | Rating | Rank | Married-couple Households |
| Crow | 0.0 /100 | #308 | Tragic 41.4% |
| Immigrants | Trinidad and Tobago | 0.0 /100 | #309 | Tragic 41.2% |
| Haitians | 0.0 /100 | #310 | Tragic 41.2% |
| Colville | 0.0 /100 | #311 | Tragic 41.0% |
| Africans | 0.0 /100 | #312 | Tragic 40.9% |
| Immigrants | Haiti | 0.0 /100 | #313 | Tragic 40.9% |
| Jamaicans | 0.0 /100 | #314 | Tragic 40.9% |
| Trinidadians and Tobagonians | 0.0 /100 | #315 | Tragic 40.9% |
| Immigrants | Caribbean | 0.0 /100 | #316 | Tragic 40.8% |
| Immigrants | Jamaica | 0.0 /100 | #317 | Tragic 40.7% |
| Liberians | 0.0 /100 | #318 | Tragic 40.7% |
| Bahamians | 0.0 /100 | #319 | Tragic 40.5% |
| West Indians | 0.0 /100 | #320 | Tragic 40.3% |
| Immigrants | Liberia | 0.0 /100 | #321 | Tragic 40.3% |
| Immigrants | Zaire | 0.0 /100 | #322 | Tragic 40.1% |