Immigrants from Chile vs Trinidadian and Tobagonian Married-couple Households
COMPARE
Immigrants from Chile
Trinidadian and Tobagonian
Married-couple Households
Married-couple Households Comparison
Immigrants from Chile
Trinidadians and Tobagonians
46.5%
MARRIED-COUPLE HOUSEHOLDS
55.7/ 100
METRIC RATING
171st/ 347
METRIC RANK
40.9%
MARRIED-COUPLE HOUSEHOLDS
0.0/ 100
METRIC RATING
315th/ 347
METRIC RANK
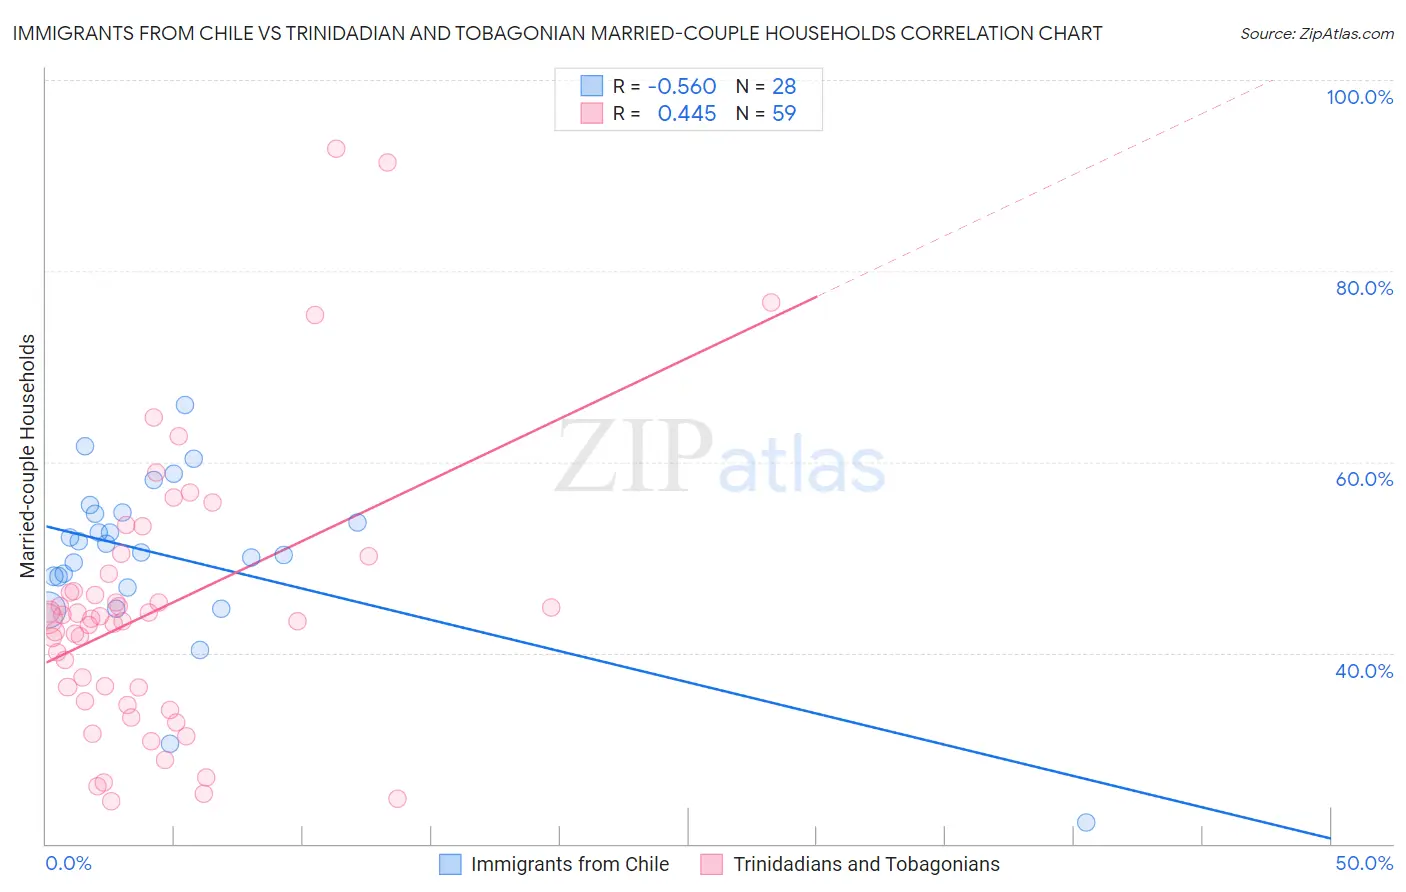
Immigrants from Chile vs Trinidadian and Tobagonian Married-couple Households Correlation Chart
The statistical analysis conducted on geographies consisting of 218,594,724 people shows a substantial negative correlation between the proportion of Immigrants from Chile and percentage of married-couple family households in the United States with a correlation coefficient (R) of -0.560 and weighted average of 46.5%. Similarly, the statistical analysis conducted on geographies consisting of 219,710,717 people shows a moderate positive correlation between the proportion of Trinidadians and Tobagonians and percentage of married-couple family households in the United States with a correlation coefficient (R) of 0.445 and weighted average of 40.9%, a difference of 13.9%.
Married-couple Households Correlation Summary
| Measurement | Immigrants from Chile | Trinidadian and Tobagonian |
| Minimum | 22.2% | 24.5% |
| Maximum | 65.9% | 92.8% |
| Range | 43.7% | 68.3% |
| Mean | 50.0% | 44.6% |
| Median | 51.0% | 43.5% |
| Interquartile 25% (IQ1) | 47.4% | 34.9% |
| Interquartile 75% (IQ3) | 54.6% | 48.2% |
| Interquartile Range (IQR) | 7.2% | 13.3% |
| Standard Deviation (Sample) | 8.8% | 14.3% |
| Standard Deviation (Population) | 8.7% | 14.2% |
Similar Demographics by Married-couple Households
Demographics Similar to Immigrants from Chile by Married-couple Households
In terms of married-couple households, the demographic groups most similar to Immigrants from Chile are Immigrants from Australia (46.5%, a difference of 0.040%), South American (46.6%, a difference of 0.090%), Spanish American Indian (46.6%, a difference of 0.14%), Immigrants from Norway (46.5%, a difference of 0.14%), and Immigrants from Mexico (46.4%, a difference of 0.22%).
| Demographics | Rating | Rank | Married-couple Households |
| Immigrants | Kazakhstan | 70.0 /100 | #164 | Good 46.8% |
| Immigrants | Southern Europe | 69.9 /100 | #165 | Good 46.8% |
| Cherokee | 65.7 /100 | #166 | Good 46.7% |
| Immigrants | Croatia | 64.2 /100 | #167 | Good 46.7% |
| Israelis | 62.3 /100 | #168 | Good 46.7% |
| Spanish American Indians | 59.4 /100 | #169 | Average 46.6% |
| South Americans | 58.0 /100 | #170 | Average 46.6% |
| Immigrants | Chile | 55.7 /100 | #171 | Average 46.5% |
| Immigrants | Australia | 54.6 /100 | #172 | Average 46.5% |
| Immigrants | Norway | 52.0 /100 | #173 | Average 46.5% |
| Immigrants | Mexico | 50.0 /100 | #174 | Average 46.4% |
| Immigrants | Colombia | 46.1 /100 | #175 | Average 46.4% |
| Cajuns | 45.2 /100 | #176 | Average 46.4% |
| Immigrants | Immigrants | 43.8 /100 | #177 | Average 46.3% |
| Immigrants | Costa Rica | 43.4 /100 | #178 | Average 46.3% |
Demographics Similar to Trinidadians and Tobagonians by Married-couple Households
In terms of married-couple households, the demographic groups most similar to Trinidadians and Tobagonians are Jamaican (40.9%, a difference of 0.080%), Immigrants from Haiti (40.9%, a difference of 0.15%), Immigrants from Caribbean (40.8%, a difference of 0.18%), African (40.9%, a difference of 0.22%), and Colville (41.0%, a difference of 0.30%).
| Demographics | Rating | Rank | Married-couple Households |
| Crow | 0.0 /100 | #308 | Tragic 41.4% |
| Immigrants | Trinidad and Tobago | 0.0 /100 | #309 | Tragic 41.2% |
| Haitians | 0.0 /100 | #310 | Tragic 41.2% |
| Colville | 0.0 /100 | #311 | Tragic 41.0% |
| Africans | 0.0 /100 | #312 | Tragic 40.9% |
| Immigrants | Haiti | 0.0 /100 | #313 | Tragic 40.9% |
| Jamaicans | 0.0 /100 | #314 | Tragic 40.9% |
| Trinidadians and Tobagonians | 0.0 /100 | #315 | Tragic 40.9% |
| Immigrants | Caribbean | 0.0 /100 | #316 | Tragic 40.8% |
| Immigrants | Jamaica | 0.0 /100 | #317 | Tragic 40.7% |
| Liberians | 0.0 /100 | #318 | Tragic 40.7% |
| Bahamians | 0.0 /100 | #319 | Tragic 40.5% |
| West Indians | 0.0 /100 | #320 | Tragic 40.3% |
| Immigrants | Liberia | 0.0 /100 | #321 | Tragic 40.3% |
| Immigrants | Zaire | 0.0 /100 | #322 | Tragic 40.1% |