Indian (Asian) vs Trinidadian and Tobagonian Married-couple Households
COMPARE
Indian (Asian)
Trinidadian and Tobagonian
Married-couple Households
Married-couple Households Comparison
Indians (Asian)
Trinidadians and Tobagonians
48.7%
MARRIED-COUPLE HOUSEHOLDS
99.4/ 100
METRIC RATING
48th/ 347
METRIC RANK
40.9%
MARRIED-COUPLE HOUSEHOLDS
0.0/ 100
METRIC RATING
315th/ 347
METRIC RANK
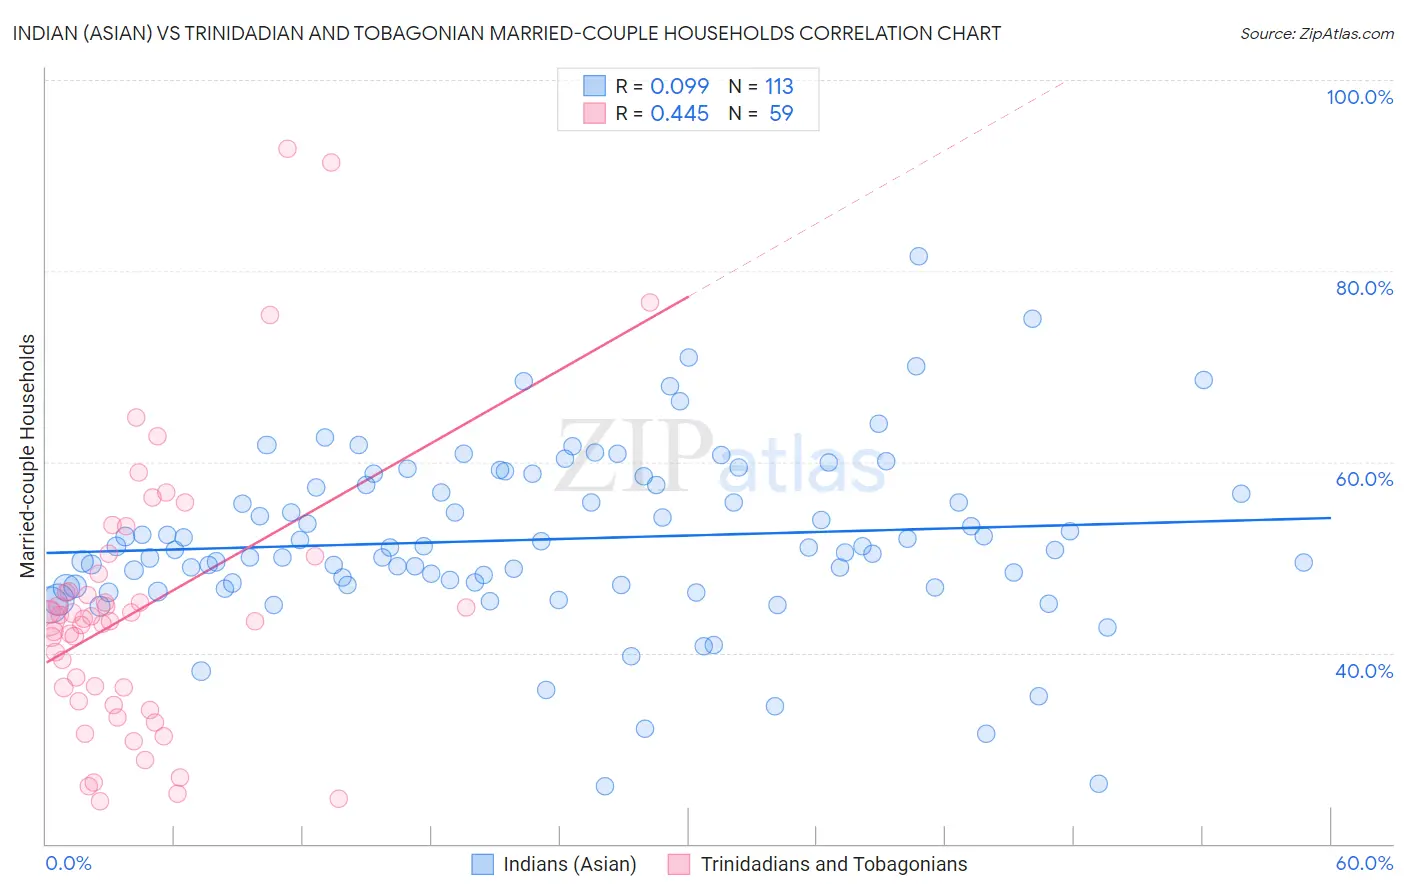
Indian (Asian) vs Trinidadian and Tobagonian Married-couple Households Correlation Chart
The statistical analysis conducted on geographies consisting of 494,754,357 people shows a slight positive correlation between the proportion of Indians (Asian) and percentage of married-couple family households in the United States with a correlation coefficient (R) of 0.099 and weighted average of 48.7%. Similarly, the statistical analysis conducted on geographies consisting of 219,710,717 people shows a moderate positive correlation between the proportion of Trinidadians and Tobagonians and percentage of married-couple family households in the United States with a correlation coefficient (R) of 0.445 and weighted average of 40.9%, a difference of 19.2%.
Married-couple Households Correlation Summary
| Measurement | Indian (Asian) | Trinidadian and Tobagonian |
| Minimum | 26.0% | 24.5% |
| Maximum | 81.5% | 92.8% |
| Range | 55.5% | 68.3% |
| Mean | 51.9% | 44.6% |
| Median | 51.0% | 43.5% |
| Interquartile 25% (IQ1) | 47.1% | 34.9% |
| Interquartile 75% (IQ3) | 57.6% | 48.2% |
| Interquartile Range (IQR) | 10.5% | 13.3% |
| Standard Deviation (Sample) | 9.1% | 14.3% |
| Standard Deviation (Population) | 9.0% | 14.2% |
Similar Demographics by Married-couple Households
Demographics Similar to Indians (Asian) by Married-couple Households
In terms of married-couple households, the demographic groups most similar to Indians (Asian) are British (48.7%, a difference of 0.050%), Immigrants from Sri Lanka (48.7%, a difference of 0.060%), Tsimshian (48.7%, a difference of 0.070%), Samoan (48.7%, a difference of 0.10%), and Immigrants from Eastern Asia (48.8%, a difference of 0.12%).
| Demographics | Rating | Rank | Married-couple Households |
| Immigrants | Lebanon | 99.6 /100 | #41 | Exceptional 48.9% |
| Immigrants | Vietnam | 99.6 /100 | #42 | Exceptional 48.8% |
| Immigrants | Iran | 99.6 /100 | #43 | Exceptional 48.8% |
| Welsh | 99.5 /100 | #44 | Exceptional 48.8% |
| Immigrants | Eastern Asia | 99.5 /100 | #45 | Exceptional 48.8% |
| Tsimshian | 99.5 /100 | #46 | Exceptional 48.7% |
| British | 99.5 /100 | #47 | Exceptional 48.7% |
| Indians (Asian) | 99.4 /100 | #48 | Exceptional 48.7% |
| Immigrants | Sri Lanka | 99.4 /100 | #49 | Exceptional 48.7% |
| Samoans | 99.4 /100 | #50 | Exceptional 48.7% |
| Eastern Europeans | 99.3 /100 | #51 | Exceptional 48.6% |
| Irish | 99.3 /100 | #52 | Exceptional 48.6% |
| Whites/Caucasians | 99.3 /100 | #53 | Exceptional 48.6% |
| Immigrants | Lithuania | 99.3 /100 | #54 | Exceptional 48.6% |
| Austrians | 99.3 /100 | #55 | Exceptional 48.6% |
Demographics Similar to Trinidadians and Tobagonians by Married-couple Households
In terms of married-couple households, the demographic groups most similar to Trinidadians and Tobagonians are Jamaican (40.9%, a difference of 0.080%), Immigrants from Haiti (40.9%, a difference of 0.15%), Immigrants from Caribbean (40.8%, a difference of 0.18%), African (40.9%, a difference of 0.22%), and Colville (41.0%, a difference of 0.30%).
| Demographics | Rating | Rank | Married-couple Households |
| Crow | 0.0 /100 | #308 | Tragic 41.4% |
| Immigrants | Trinidad and Tobago | 0.0 /100 | #309 | Tragic 41.2% |
| Haitians | 0.0 /100 | #310 | Tragic 41.2% |
| Colville | 0.0 /100 | #311 | Tragic 41.0% |
| Africans | 0.0 /100 | #312 | Tragic 40.9% |
| Immigrants | Haiti | 0.0 /100 | #313 | Tragic 40.9% |
| Jamaicans | 0.0 /100 | #314 | Tragic 40.9% |
| Trinidadians and Tobagonians | 0.0 /100 | #315 | Tragic 40.9% |
| Immigrants | Caribbean | 0.0 /100 | #316 | Tragic 40.8% |
| Immigrants | Jamaica | 0.0 /100 | #317 | Tragic 40.7% |
| Liberians | 0.0 /100 | #318 | Tragic 40.7% |
| Bahamians | 0.0 /100 | #319 | Tragic 40.5% |
| West Indians | 0.0 /100 | #320 | Tragic 40.3% |
| Immigrants | Liberia | 0.0 /100 | #321 | Tragic 40.3% |
| Immigrants | Zaire | 0.0 /100 | #322 | Tragic 40.1% |