Iroquois vs Trinidadian and Tobagonian Female Disability
COMPARE
Iroquois
Trinidadian and Tobagonian
Female Disability
Female Disability Comparison
Iroquois
Trinidadians and Tobagonians
14.0%
FEMALE DISABILITY
0.0/ 100
METRIC RATING
319th/ 347
METRIC RANK
12.3%
FEMALE DISABILITY
22.4/ 100
METRIC RATING
200th/ 347
METRIC RANK
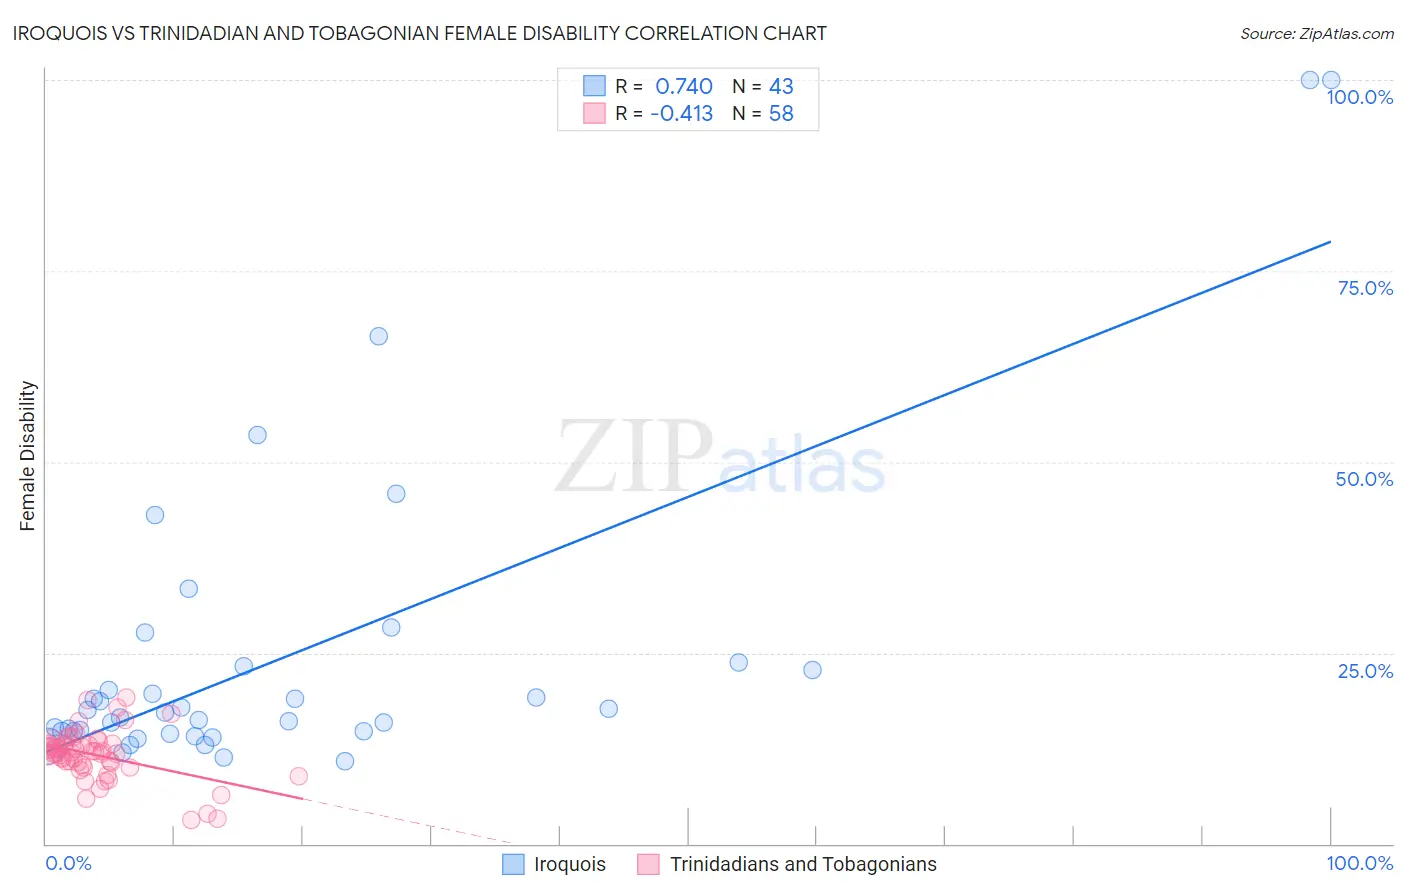
Iroquois vs Trinidadian and Tobagonian Female Disability Correlation Chart
The statistical analysis conducted on geographies consisting of 207,273,791 people shows a strong positive correlation between the proportion of Iroquois and percentage of females with a disability in the United States with a correlation coefficient (R) of 0.740 and weighted average of 14.0%. Similarly, the statistical analysis conducted on geographies consisting of 219,838,071 people shows a moderate negative correlation between the proportion of Trinidadians and Tobagonians and percentage of females with a disability in the United States with a correlation coefficient (R) of -0.413 and weighted average of 12.3%, a difference of 13.9%.
Female Disability Correlation Summary
| Measurement | Iroquois | Trinidadian and Tobagonian |
| Minimum | 10.9% | 3.2% |
| Maximum | 100.0% | 19.2% |
| Range | 89.1% | 16.0% |
| Mean | 24.5% | 11.6% |
| Median | 17.2% | 12.0% |
| Interquartile 25% (IQ1) | 14.7% | 10.3% |
| Interquartile 75% (IQ3) | 23.2% | 13.0% |
| Interquartile Range (IQR) | 8.6% | 2.7% |
| Standard Deviation (Sample) | 20.4% | 3.3% |
| Standard Deviation (Population) | 20.2% | 3.3% |
Similar Demographics by Female Disability
Demographics Similar to Iroquois by Female Disability
In terms of female disability, the demographic groups most similar to Iroquois are Paiute (14.0%, a difference of 0.29%), American (14.1%, a difference of 0.34%), Chippewa (14.0%, a difference of 0.40%), Potawatomi (14.1%, a difference of 0.48%), and Pueblo (14.1%, a difference of 0.49%).
| Demographics | Rating | Rank | Female Disability |
| Delaware | 0.0 /100 | #312 | Tragic 13.8% |
| Blackfeet | 0.0 /100 | #313 | Tragic 13.8% |
| Puget Sound Salish | 0.0 /100 | #314 | Tragic 13.8% |
| Alaskan Athabascans | 0.0 /100 | #315 | Tragic 13.9% |
| Spanish Americans | 0.0 /100 | #316 | Tragic 14.0% |
| Chippewa | 0.0 /100 | #317 | Tragic 14.0% |
| Paiute | 0.0 /100 | #318 | Tragic 14.0% |
| Iroquois | 0.0 /100 | #319 | Tragic 14.0% |
| Americans | 0.0 /100 | #320 | Tragic 14.1% |
| Potawatomi | 0.0 /100 | #321 | Tragic 14.1% |
| Pueblo | 0.0 /100 | #322 | Tragic 14.1% |
| Blacks/African Americans | 0.0 /100 | #323 | Tragic 14.1% |
| Natives/Alaskans | 0.0 /100 | #324 | Tragic 14.1% |
| Navajo | 0.0 /100 | #325 | Tragic 14.2% |
| Comanche | 0.0 /100 | #326 | Tragic 14.2% |
Demographics Similar to Trinidadians and Tobagonians by Female Disability
In terms of female disability, the demographic groups most similar to Trinidadians and Tobagonians are Chinese (12.3%, a difference of 0.010%), Somali (12.3%, a difference of 0.040%), Immigrants from Barbados (12.3%, a difference of 0.070%), Immigrants from Zaire (12.3%, a difference of 0.080%), and Immigrants from Grenada (12.4%, a difference of 0.10%).
| Demographics | Rating | Rank | Female Disability |
| Northern Europeans | 27.5 /100 | #193 | Fair 12.3% |
| Ukrainians | 27.2 /100 | #194 | Fair 12.3% |
| Swedes | 26.6 /100 | #195 | Fair 12.3% |
| Immigrants | Panama | 25.5 /100 | #196 | Fair 12.3% |
| Hondurans | 25.4 /100 | #197 | Fair 12.3% |
| Mexican American Indians | 24.9 /100 | #198 | Fair 12.3% |
| Immigrants | Trinidad and Tobago | 24.7 /100 | #199 | Fair 12.3% |
| Trinidadians and Tobagonians | 22.4 /100 | #200 | Fair 12.3% |
| Chinese | 22.1 /100 | #201 | Fair 12.3% |
| Somalis | 21.5 /100 | #202 | Fair 12.3% |
| Immigrants | Barbados | 21.1 /100 | #203 | Fair 12.3% |
| Immigrants | Zaire | 20.9 /100 | #204 | Fair 12.3% |
| Immigrants | Grenada | 20.5 /100 | #205 | Fair 12.4% |
| Immigrants | Cuba | 20.2 /100 | #206 | Fair 12.4% |
| Croatians | 20.2 /100 | #207 | Fair 12.4% |