Iroquois vs Immigrants from Peru Married-couple Households
COMPARE
Iroquois
Immigrants from Peru
Married-couple Households
Married-couple Households Comparison
Iroquois
Immigrants from Peru
43.7%
MARRIED-COUPLE HOUSEHOLDS
0.2/ 100
METRIC RATING
259th/ 347
METRIC RANK
47.3%
MARRIED-COUPLE HOUSEHOLDS
87.9/ 100
METRIC RATING
128th/ 347
METRIC RANK
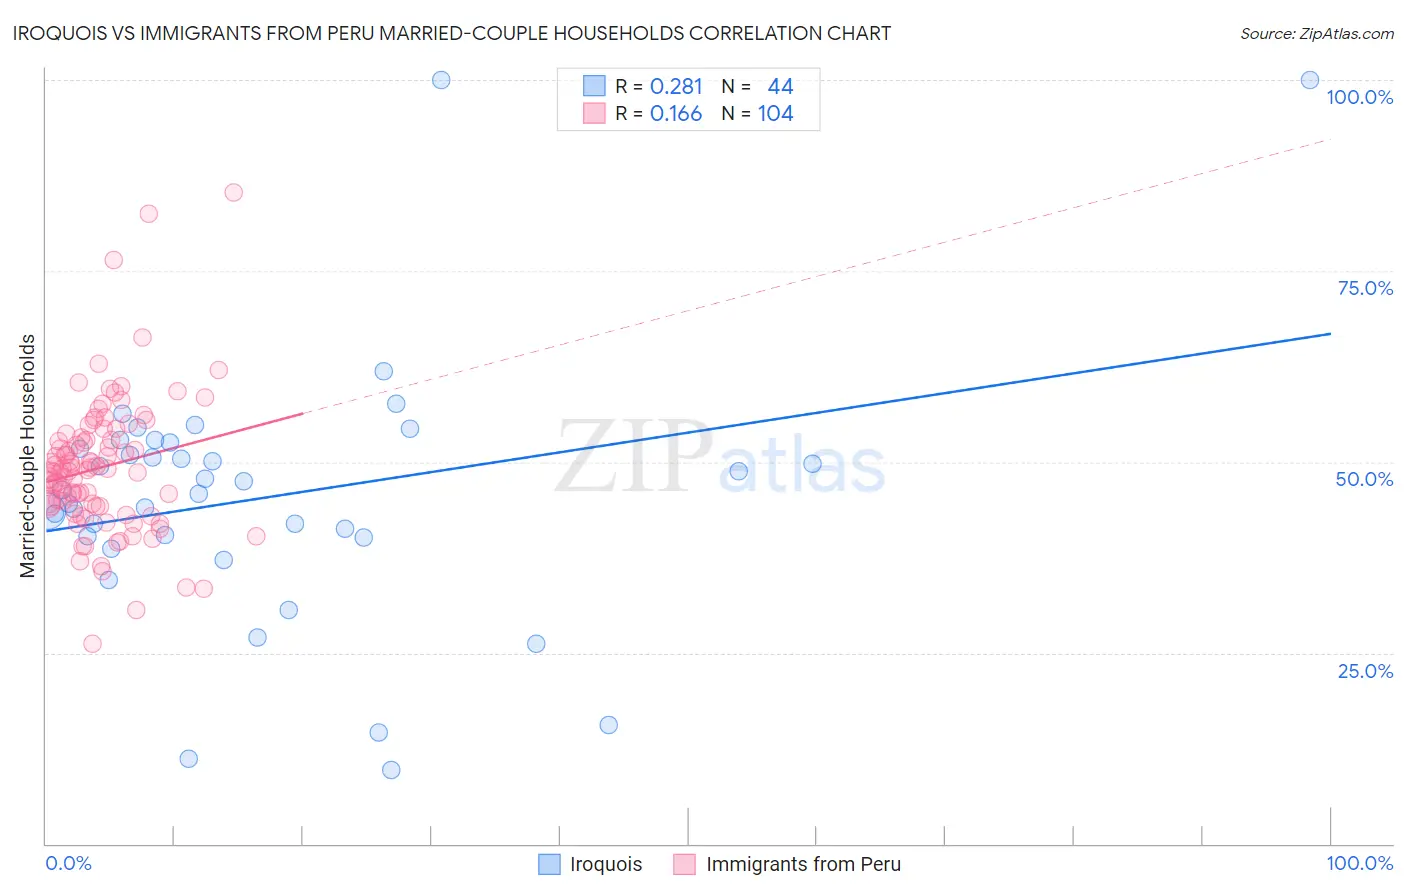
Iroquois vs Immigrants from Peru Married-couple Households Correlation Chart
The statistical analysis conducted on geographies consisting of 207,249,804 people shows a weak positive correlation between the proportion of Iroquois and percentage of married-couple family households in the United States with a correlation coefficient (R) of 0.281 and weighted average of 43.7%. Similarly, the statistical analysis conducted on geographies consisting of 328,750,630 people shows a poor positive correlation between the proportion of Immigrants from Peru and percentage of married-couple family households in the United States with a correlation coefficient (R) of 0.166 and weighted average of 47.3%, a difference of 8.2%.
Married-couple Households Correlation Summary
| Measurement | Iroquois | Immigrants from Peru |
| Minimum | 9.6% | 26.2% |
| Maximum | 100.0% | 85.3% |
| Range | 90.4% | 59.1% |
| Mean | 45.4% | 49.2% |
| Median | 46.1% | 48.9% |
| Interquartile 25% (IQ1) | 40.2% | 44.3% |
| Interquartile 75% (IQ3) | 52.1% | 53.0% |
| Interquartile Range (IQR) | 12.0% | 8.7% |
| Standard Deviation (Sample) | 17.2% | 9.0% |
| Standard Deviation (Population) | 17.0% | 9.0% |
Similar Demographics by Married-couple Households
Demographics Similar to Iroquois by Married-couple Households
In terms of married-couple households, the demographic groups most similar to Iroquois are Central American Indian (43.8%, a difference of 0.030%), Blackfeet (43.8%, a difference of 0.070%), Immigrants from Cameroon (43.7%, a difference of 0.090%), Alaskan Athabascan (43.6%, a difference of 0.22%), and Ugandan (43.8%, a difference of 0.23%).
| Demographics | Rating | Rank | Married-couple Households |
| Seminole | 0.4 /100 | #252 | Tragic 44.0% |
| Central Americans | 0.3 /100 | #253 | Tragic 43.9% |
| Apache | 0.3 /100 | #254 | Tragic 43.9% |
| Shoshone | 0.3 /100 | #255 | Tragic 43.9% |
| Ugandans | 0.3 /100 | #256 | Tragic 43.8% |
| Blackfeet | 0.2 /100 | #257 | Tragic 43.8% |
| Central American Indians | 0.2 /100 | #258 | Tragic 43.8% |
| Iroquois | 0.2 /100 | #259 | Tragic 43.7% |
| Immigrants | Cameroon | 0.2 /100 | #260 | Tragic 43.7% |
| Alaskan Athabascans | 0.2 /100 | #261 | Tragic 43.6% |
| Vietnamese | 0.2 /100 | #262 | Tragic 43.6% |
| Cree | 0.1 /100 | #263 | Tragic 43.6% |
| Bangladeshis | 0.1 /100 | #264 | Tragic 43.5% |
| Moroccans | 0.1 /100 | #265 | Tragic 43.5% |
| Ecuadorians | 0.1 /100 | #266 | Tragic 43.5% |
Demographics Similar to Immigrants from Peru by Married-couple Households
In terms of married-couple households, the demographic groups most similar to Immigrants from Peru are Immigrants from Iraq (47.3%, a difference of 0.010%), Immigrants from Hungary (47.3%, a difference of 0.010%), Celtic (47.3%, a difference of 0.020%), Immigrants from Denmark (47.3%, a difference of 0.030%), and Pakistani (47.3%, a difference of 0.070%).
| Demographics | Rating | Rank | Married-couple Households |
| Immigrants | Eastern Europe | 90.3 /100 | #121 | Exceptional 47.4% |
| Okinawans | 90.1 /100 | #122 | Exceptional 47.4% |
| Immigrants | Venezuela | 89.3 /100 | #123 | Excellent 47.4% |
| Zimbabweans | 89.2 /100 | #124 | Excellent 47.4% |
| Australians | 89.0 /100 | #125 | Excellent 47.4% |
| Pakistanis | 88.6 /100 | #126 | Excellent 47.3% |
| Celtics | 88.1 /100 | #127 | Excellent 47.3% |
| Immigrants | Peru | 87.9 /100 | #128 | Excellent 47.3% |
| Immigrants | Iraq | 87.8 /100 | #129 | Excellent 47.3% |
| Immigrants | Hungary | 87.8 /100 | #130 | Excellent 47.3% |
| Immigrants | Denmark | 87.5 /100 | #131 | Excellent 47.3% |
| Immigrants | Ukraine | 86.7 /100 | #132 | Excellent 47.3% |
| South Africans | 86.4 /100 | #133 | Excellent 47.3% |
| Immigrants | Greece | 86.0 /100 | #134 | Excellent 47.2% |
| Immigrants | Argentina | 86.0 /100 | #135 | Excellent 47.2% |