Paraguayan vs Trinidadian and Tobagonian Married-couple Households
COMPARE
Paraguayan
Trinidadian and Tobagonian
Married-couple Households
Married-couple Households Comparison
Paraguayans
Trinidadians and Tobagonians
47.0%
MARRIED-COUPLE HOUSEHOLDS
78.7/ 100
METRIC RATING
149th/ 347
METRIC RANK
40.9%
MARRIED-COUPLE HOUSEHOLDS
0.0/ 100
METRIC RATING
315th/ 347
METRIC RANK
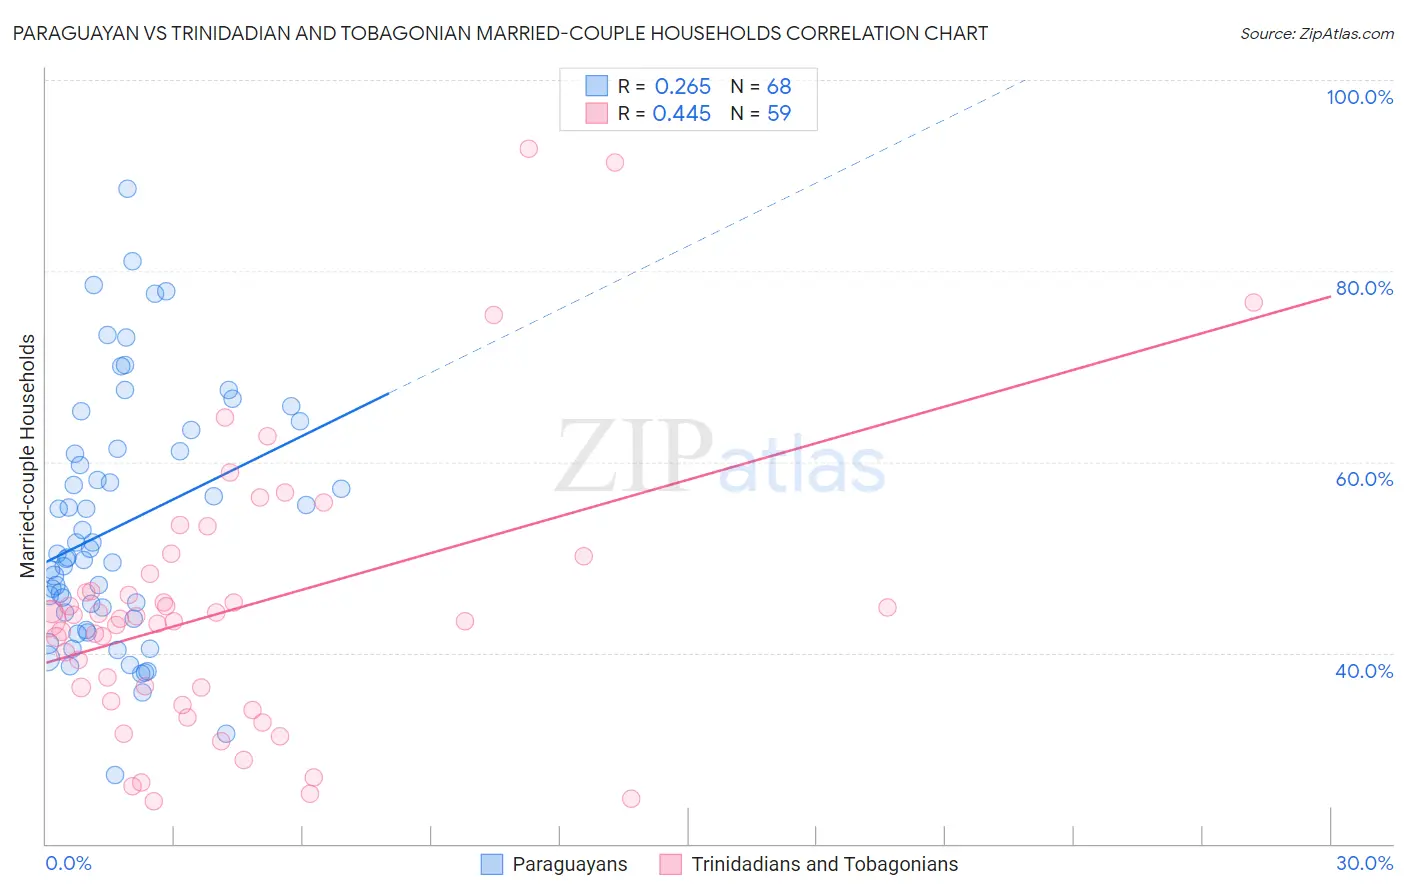
Paraguayan vs Trinidadian and Tobagonian Married-couple Households Correlation Chart
The statistical analysis conducted on geographies consisting of 95,096,913 people shows a weak positive correlation between the proportion of Paraguayans and percentage of married-couple family households in the United States with a correlation coefficient (R) of 0.265 and weighted average of 47.0%. Similarly, the statistical analysis conducted on geographies consisting of 219,710,717 people shows a moderate positive correlation between the proportion of Trinidadians and Tobagonians and percentage of married-couple family households in the United States with a correlation coefficient (R) of 0.445 and weighted average of 40.9%, a difference of 15.1%.
Married-couple Households Correlation Summary
| Measurement | Paraguayan | Trinidadian and Tobagonian |
| Minimum | 27.2% | 24.5% |
| Maximum | 88.5% | 92.8% |
| Range | 61.4% | 68.3% |
| Mean | 53.2% | 44.6% |
| Median | 50.2% | 43.5% |
| Interquartile 25% (IQ1) | 43.9% | 34.9% |
| Interquartile 75% (IQ3) | 61.2% | 48.2% |
| Interquartile Range (IQR) | 17.3% | 13.3% |
| Standard Deviation (Sample) | 12.9% | 14.3% |
| Standard Deviation (Population) | 12.8% | 14.2% |
Similar Demographics by Married-couple Households
Demographics Similar to Paraguayans by Married-couple Households
In terms of married-couple households, the demographic groups most similar to Paraguayans are Icelander (47.0%, a difference of 0.050%), Immigrants from Russia (47.0%, a difference of 0.060%), Immigrants from Bulgaria (47.0%, a difference of 0.10%), Serbian (47.0%, a difference of 0.12%), and Hmong (47.0%, a difference of 0.13%).
| Demographics | Rating | Rank | Married-couple Households |
| Spaniards | 84.1 /100 | #142 | Excellent 47.2% |
| Immigrants | Belarus | 83.8 /100 | #143 | Excellent 47.2% |
| Mexicans | 83.4 /100 | #144 | Excellent 47.1% |
| Slovenes | 81.7 /100 | #145 | Excellent 47.1% |
| Immigrants | Western Europe | 81.6 /100 | #146 | Excellent 47.1% |
| Immigrants | Syria | 81.6 /100 | #147 | Excellent 47.1% |
| Icelanders | 79.5 /100 | #148 | Good 47.0% |
| Paraguayans | 78.7 /100 | #149 | Good 47.0% |
| Immigrants | Russia | 77.6 /100 | #150 | Good 47.0% |
| Immigrants | Bulgaria | 76.8 /100 | #151 | Good 47.0% |
| Serbians | 76.3 /100 | #152 | Good 47.0% |
| Hmong | 76.2 /100 | #153 | Good 47.0% |
| Immigrants | Western Asia | 76.1 /100 | #154 | Good 46.9% |
| Arabs | 76.0 /100 | #155 | Good 46.9% |
| Armenians | 75.4 /100 | #156 | Good 46.9% |
Demographics Similar to Trinidadians and Tobagonians by Married-couple Households
In terms of married-couple households, the demographic groups most similar to Trinidadians and Tobagonians are Jamaican (40.9%, a difference of 0.080%), Immigrants from Haiti (40.9%, a difference of 0.15%), Immigrants from Caribbean (40.8%, a difference of 0.18%), African (40.9%, a difference of 0.22%), and Colville (41.0%, a difference of 0.30%).
| Demographics | Rating | Rank | Married-couple Households |
| Crow | 0.0 /100 | #308 | Tragic 41.4% |
| Immigrants | Trinidad and Tobago | 0.0 /100 | #309 | Tragic 41.2% |
| Haitians | 0.0 /100 | #310 | Tragic 41.2% |
| Colville | 0.0 /100 | #311 | Tragic 41.0% |
| Africans | 0.0 /100 | #312 | Tragic 40.9% |
| Immigrants | Haiti | 0.0 /100 | #313 | Tragic 40.9% |
| Jamaicans | 0.0 /100 | #314 | Tragic 40.9% |
| Trinidadians and Tobagonians | 0.0 /100 | #315 | Tragic 40.9% |
| Immigrants | Caribbean | 0.0 /100 | #316 | Tragic 40.8% |
| Immigrants | Jamaica | 0.0 /100 | #317 | Tragic 40.7% |
| Liberians | 0.0 /100 | #318 | Tragic 40.7% |
| Bahamians | 0.0 /100 | #319 | Tragic 40.5% |
| West Indians | 0.0 /100 | #320 | Tragic 40.3% |
| Immigrants | Liberia | 0.0 /100 | #321 | Tragic 40.3% |
| Immigrants | Zaire | 0.0 /100 | #322 | Tragic 40.1% |