Immigrants from Grenada vs Trinidadian and Tobagonian Married-couple Households
COMPARE
Immigrants from Grenada
Trinidadian and Tobagonian
Married-couple Households
Married-couple Households Comparison
Immigrants from Grenada
Trinidadians and Tobagonians
37.5%
MARRIED-COUPLE HOUSEHOLDS
0.0/ 100
METRIC RATING
343rd/ 347
METRIC RANK
40.9%
MARRIED-COUPLE HOUSEHOLDS
0.0/ 100
METRIC RATING
315th/ 347
METRIC RANK
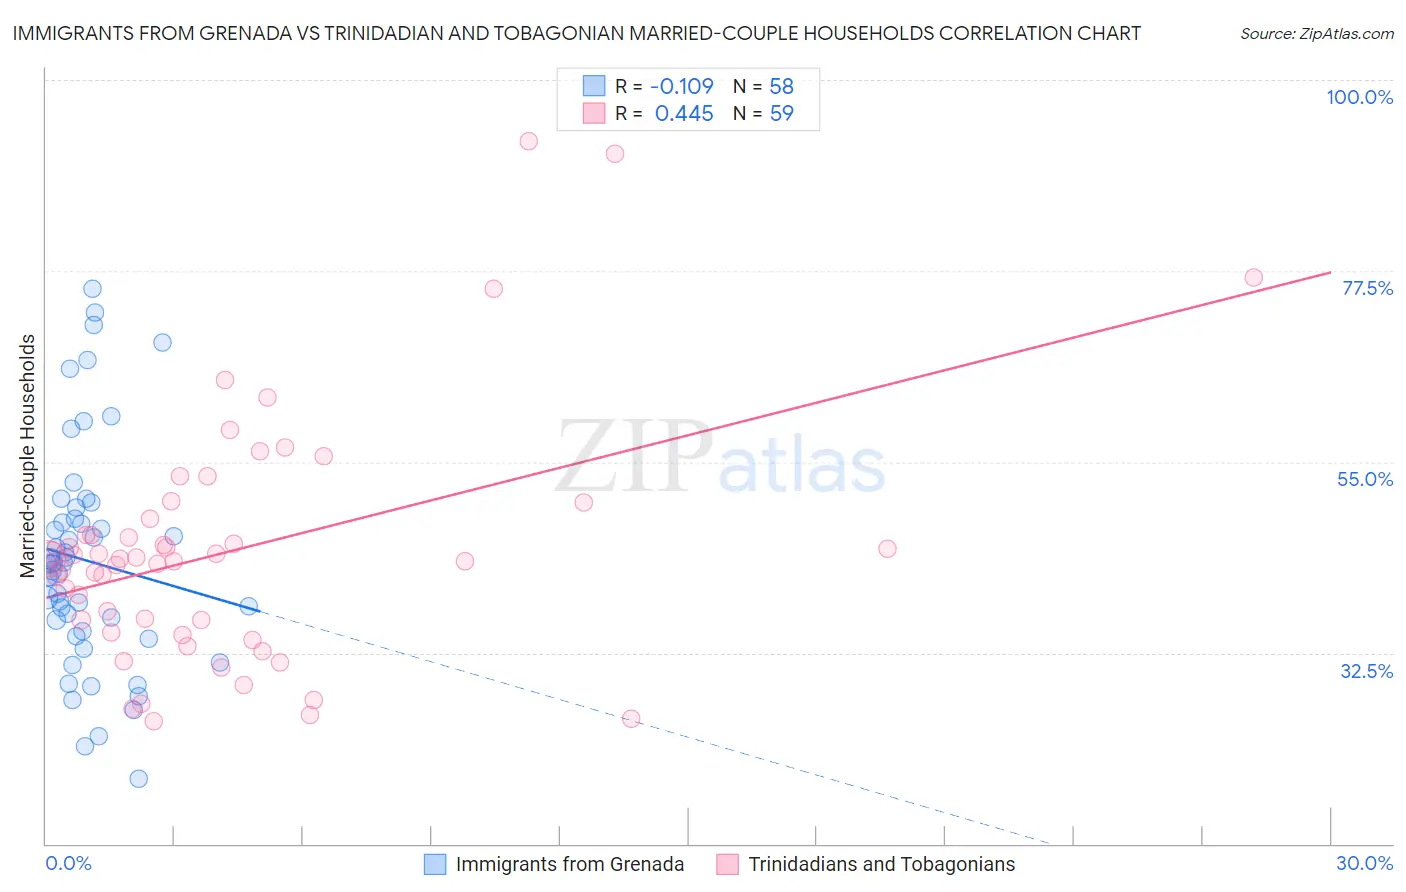
Immigrants from Grenada vs Trinidadian and Tobagonian Married-couple Households Correlation Chart
The statistical analysis conducted on geographies consisting of 67,190,411 people shows a poor negative correlation between the proportion of Immigrants from Grenada and percentage of married-couple family households in the United States with a correlation coefficient (R) of -0.109 and weighted average of 37.5%. Similarly, the statistical analysis conducted on geographies consisting of 219,710,717 people shows a moderate positive correlation between the proportion of Trinidadians and Tobagonians and percentage of married-couple family households in the United States with a correlation coefficient (R) of 0.445 and weighted average of 40.9%, a difference of 8.9%.
Married-couple Households Correlation Summary
| Measurement | Immigrants from Grenada | Trinidadian and Tobagonian |
| Minimum | 17.7% | 24.5% |
| Maximum | 75.4% | 92.8% |
| Range | 57.7% | 68.3% |
| Mean | 43.4% | 44.6% |
| Median | 43.0% | 43.5% |
| Interquartile 25% (IQ1) | 35.1% | 34.9% |
| Interquartile 75% (IQ3) | 48.3% | 48.2% |
| Interquartile Range (IQR) | 13.3% | 13.3% |
| Standard Deviation (Sample) | 12.9% | 14.3% |
| Standard Deviation (Population) | 12.8% | 14.2% |
Similar Demographics by Married-couple Households
Demographics Similar to Immigrants from Grenada by Married-couple Households
In terms of married-couple households, the demographic groups most similar to Immigrants from Grenada are Immigrants from Dominican Republic (37.3%, a difference of 0.43%), Tohono O'odham (37.9%, a difference of 1.1%), Cape Verdean (38.1%, a difference of 1.7%), Dominican (38.2%, a difference of 1.8%), and British West Indian (38.3%, a difference of 2.2%).
| Demographics | Rating | Rank | Married-couple Households |
| Immigrants | West Indies | 0.0 /100 | #333 | Tragic 39.0% |
| Immigrants | St. Vincent and the Grenadines | 0.0 /100 | #334 | Tragic 38.7% |
| Senegalese | 0.0 /100 | #335 | Tragic 38.6% |
| Blacks/African Americans | 0.0 /100 | #336 | Tragic 38.5% |
| Immigrants | Somalia | 0.0 /100 | #337 | Tragic 38.4% |
| Immigrants | Senegal | 0.0 /100 | #338 | Tragic 38.4% |
| British West Indians | 0.0 /100 | #339 | Tragic 38.3% |
| Dominicans | 0.0 /100 | #340 | Tragic 38.2% |
| Cape Verdeans | 0.0 /100 | #341 | Tragic 38.1% |
| Tohono O'odham | 0.0 /100 | #342 | Tragic 37.9% |
| Immigrants | Grenada | 0.0 /100 | #343 | Tragic 37.5% |
| Immigrants | Dominican Republic | 0.0 /100 | #344 | Tragic 37.3% |
| Hopi | 0.0 /100 | #345 | Tragic 36.7% |
| Immigrants | Cabo Verde | 0.0 /100 | #346 | Tragic 36.2% |
| Pima | 0.0 /100 | #347 | Tragic 35.6% |
Demographics Similar to Trinidadians and Tobagonians by Married-couple Households
In terms of married-couple households, the demographic groups most similar to Trinidadians and Tobagonians are Jamaican (40.9%, a difference of 0.080%), Immigrants from Haiti (40.9%, a difference of 0.15%), Immigrants from Caribbean (40.8%, a difference of 0.18%), African (40.9%, a difference of 0.22%), and Colville (41.0%, a difference of 0.30%).
| Demographics | Rating | Rank | Married-couple Households |
| Crow | 0.0 /100 | #308 | Tragic 41.4% |
| Immigrants | Trinidad and Tobago | 0.0 /100 | #309 | Tragic 41.2% |
| Haitians | 0.0 /100 | #310 | Tragic 41.2% |
| Colville | 0.0 /100 | #311 | Tragic 41.0% |
| Africans | 0.0 /100 | #312 | Tragic 40.9% |
| Immigrants | Haiti | 0.0 /100 | #313 | Tragic 40.9% |
| Jamaicans | 0.0 /100 | #314 | Tragic 40.9% |
| Trinidadians and Tobagonians | 0.0 /100 | #315 | Tragic 40.9% |
| Immigrants | Caribbean | 0.0 /100 | #316 | Tragic 40.8% |
| Immigrants | Jamaica | 0.0 /100 | #317 | Tragic 40.7% |
| Liberians | 0.0 /100 | #318 | Tragic 40.7% |
| Bahamians | 0.0 /100 | #319 | Tragic 40.5% |
| West Indians | 0.0 /100 | #320 | Tragic 40.3% |
| Immigrants | Liberia | 0.0 /100 | #321 | Tragic 40.3% |
| Immigrants | Zaire | 0.0 /100 | #322 | Tragic 40.1% |