Immigrants from St. Vincent and the Grenadines vs Trinidadian and Tobagonian Married-couple Households
COMPARE
Immigrants from St. Vincent and the Grenadines
Trinidadian and Tobagonian
Married-couple Households
Married-couple Households Comparison
Immigrants from St. Vincent and the Grenadines
Trinidadians and Tobagonians
38.7%
MARRIED-COUPLE HOUSEHOLDS
0.0/ 100
METRIC RATING
334th/ 347
METRIC RANK
40.9%
MARRIED-COUPLE HOUSEHOLDS
0.0/ 100
METRIC RATING
315th/ 347
METRIC RANK
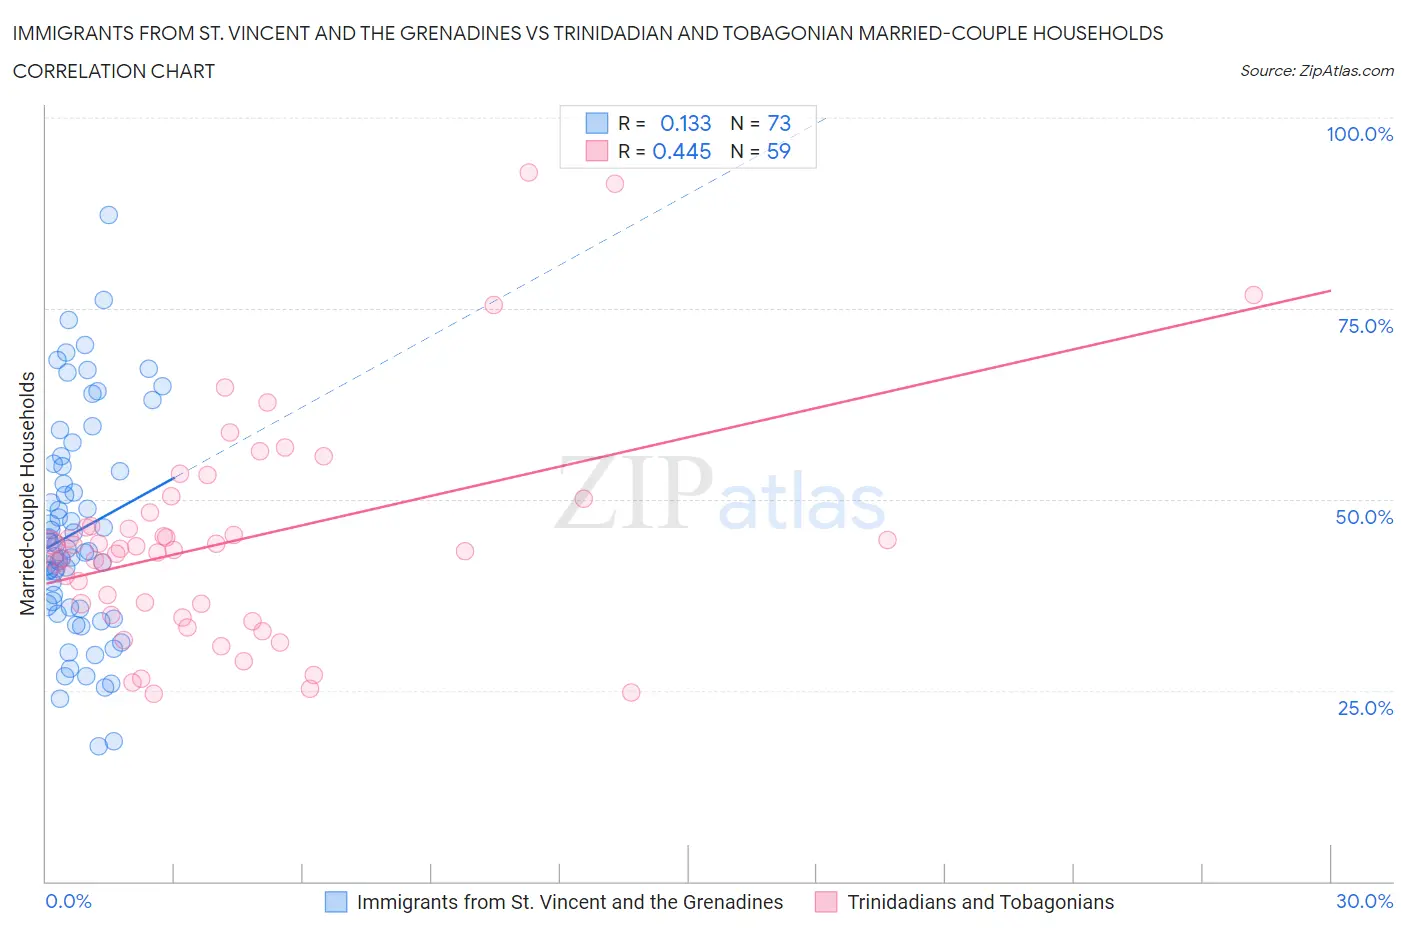
Immigrants from St. Vincent and the Grenadines vs Trinidadian and Tobagonian Married-couple Households Correlation Chart
The statistical analysis conducted on geographies consisting of 56,188,620 people shows a poor positive correlation between the proportion of Immigrants from St. Vincent and the Grenadines and percentage of married-couple family households in the United States with a correlation coefficient (R) of 0.133 and weighted average of 38.7%. Similarly, the statistical analysis conducted on geographies consisting of 219,710,717 people shows a moderate positive correlation between the proportion of Trinidadians and Tobagonians and percentage of married-couple family households in the United States with a correlation coefficient (R) of 0.445 and weighted average of 40.9%, a difference of 5.6%.
Married-couple Households Correlation Summary
| Measurement | Immigrants from St. Vincent and the Grenadines | Trinidadian and Tobagonian |
| Minimum | 17.7% | 24.5% |
| Maximum | 87.2% | 92.8% |
| Range | 69.5% | 68.3% |
| Mean | 45.8% | 44.6% |
| Median | 43.5% | 43.5% |
| Interquartile 25% (IQ1) | 35.8% | 34.9% |
| Interquartile 75% (IQ3) | 54.5% | 48.2% |
| Interquartile Range (IQR) | 18.8% | 13.3% |
| Standard Deviation (Sample) | 14.4% | 14.3% |
| Standard Deviation (Population) | 14.3% | 14.2% |
Demographics Similar to Immigrants from St. Vincent and the Grenadines and Trinidadians and Tobagonians by Married-couple Households
In terms of married-couple households, the demographic groups most similar to Immigrants from St. Vincent and the Grenadines are Immigrants from West Indies (39.0%, a difference of 0.78%), Somali (39.0%, a difference of 0.81%), Immigrants from Congo (39.0%, a difference of 0.90%), Immigrants from Barbados (39.2%, a difference of 1.3%), and Immigrants from Dominica (39.4%, a difference of 1.8%). Similarly, the demographic groups most similar to Trinidadians and Tobagonians are Jamaican (40.9%, a difference of 0.080%), Immigrants from Caribbean (40.8%, a difference of 0.18%), Immigrants from Jamaica (40.7%, a difference of 0.47%), Liberian (40.7%, a difference of 0.48%), and Bahamian (40.5%, a difference of 0.83%).
| Demographics | Rating | Rank | Married-couple Households |
| Jamaicans | 0.0 /100 | #314 | Tragic 40.9% |
| Trinidadians and Tobagonians | 0.0 /100 | #315 | Tragic 40.9% |
| Immigrants | Caribbean | 0.0 /100 | #316 | Tragic 40.8% |
| Immigrants | Jamaica | 0.0 /100 | #317 | Tragic 40.7% |
| Liberians | 0.0 /100 | #318 | Tragic 40.7% |
| Bahamians | 0.0 /100 | #319 | Tragic 40.5% |
| West Indians | 0.0 /100 | #320 | Tragic 40.3% |
| Immigrants | Liberia | 0.0 /100 | #321 | Tragic 40.3% |
| Immigrants | Zaire | 0.0 /100 | #322 | Tragic 40.1% |
| Puerto Ricans | 0.0 /100 | #323 | Tragic 40.1% |
| Navajo | 0.0 /100 | #324 | Tragic 40.1% |
| Pueblo | 0.0 /100 | #325 | Tragic 40.0% |
| U.S. Virgin Islanders | 0.0 /100 | #326 | Tragic 39.8% |
| Lumbee | 0.0 /100 | #327 | Tragic 39.6% |
| Barbadians | 0.0 /100 | #328 | Tragic 39.4% |
| Immigrants | Dominica | 0.0 /100 | #329 | Tragic 39.4% |
| Immigrants | Barbados | 0.0 /100 | #330 | Tragic 39.2% |
| Immigrants | Congo | 0.0 /100 | #331 | Tragic 39.0% |
| Somalis | 0.0 /100 | #332 | Tragic 39.0% |
| Immigrants | West Indies | 0.0 /100 | #333 | Tragic 39.0% |
| Immigrants | St. Vincent and the Grenadines | 0.0 /100 | #334 | Tragic 38.7% |