Immigrants from Trinidad and Tobago vs Lithuanian Associate's Degree
COMPARE
Immigrants from Trinidad and Tobago
Lithuanian
Associate's Degree
Associate's Degree Comparison
Immigrants from Trinidad and Tobago
Lithuanians
43.3%
ASSOCIATE'S DEGREE
3.0/ 100
METRIC RATING
229th/ 347
METRIC RANK
50.6%
ASSOCIATE'S DEGREE
99.3/ 100
METRIC RATING
74th/ 347
METRIC RANK
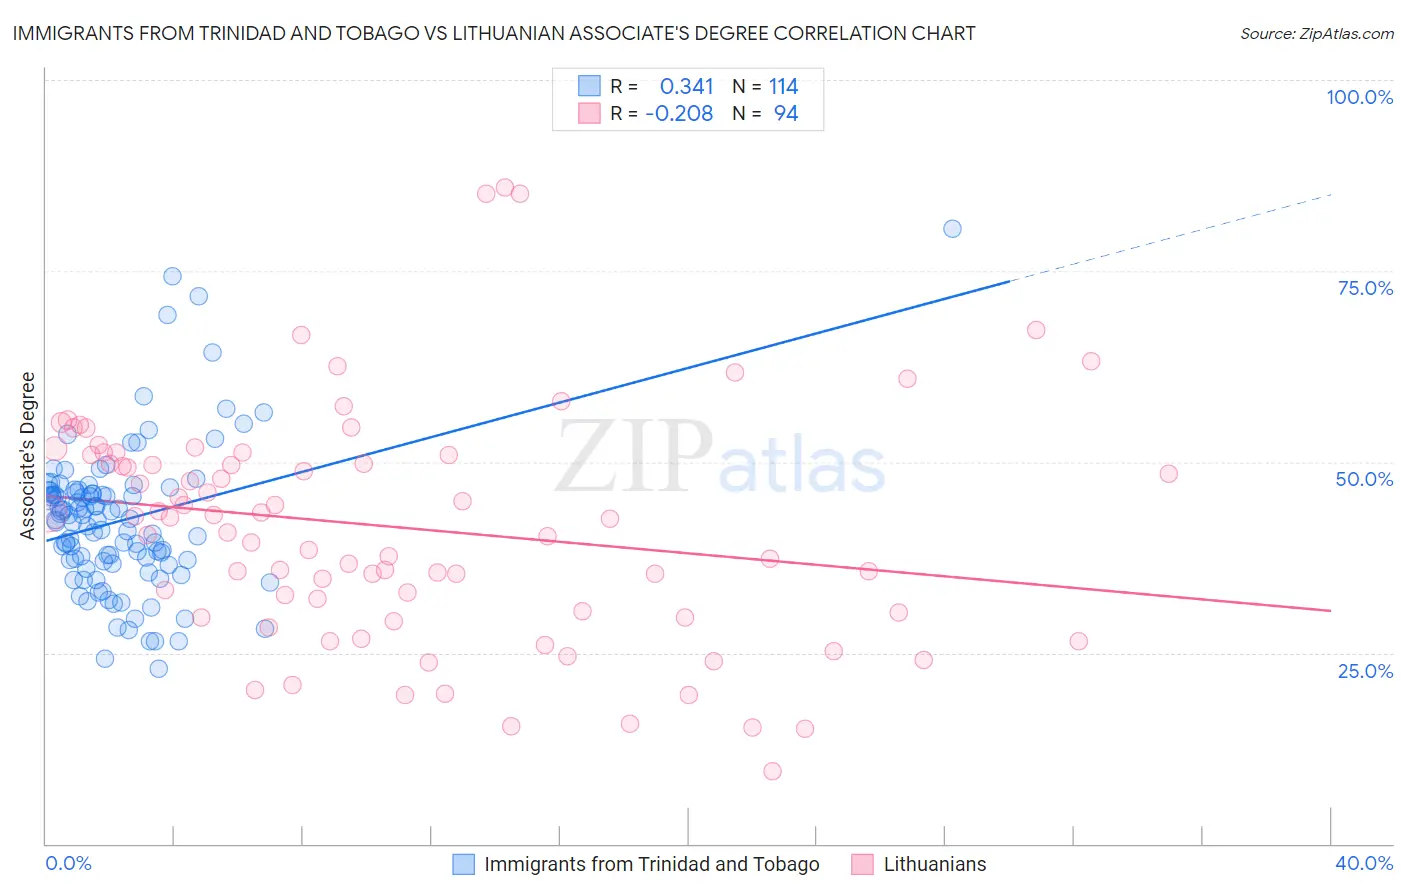
Immigrants from Trinidad and Tobago vs Lithuanian Associate's Degree Correlation Chart
The statistical analysis conducted on geographies consisting of 223,520,472 people shows a mild positive correlation between the proportion of Immigrants from Trinidad and Tobago and percentage of population with at least associate's degree education in the United States with a correlation coefficient (R) of 0.341 and weighted average of 43.3%. Similarly, the statistical analysis conducted on geographies consisting of 421,924,512 people shows a weak negative correlation between the proportion of Lithuanians and percentage of population with at least associate's degree education in the United States with a correlation coefficient (R) of -0.208 and weighted average of 50.6%, a difference of 16.8%.
Associate's Degree Correlation Summary
| Measurement | Immigrants from Trinidad and Tobago | Lithuanian |
| Minimum | 23.0% | 9.5% |
| Maximum | 80.5% | 85.9% |
| Range | 57.6% | 76.4% |
| Mean | 42.4% | 41.4% |
| Median | 42.4% | 42.6% |
| Interquartile 25% (IQ1) | 37.0% | 30.2% |
| Interquartile 75% (IQ3) | 46.1% | 50.9% |
| Interquartile Range (IQR) | 9.1% | 20.7% |
| Standard Deviation (Sample) | 9.7% | 15.3% |
| Standard Deviation (Population) | 9.7% | 15.3% |
Similar Demographics by Associate's Degree
Demographics Similar to Immigrants from Trinidad and Tobago by Associate's Degree
In terms of associate's degree, the demographic groups most similar to Immigrants from Trinidad and Tobago are Immigrants from Barbados (43.3%, a difference of 0.070%), Liberian (43.3%, a difference of 0.080%), Hmong (43.4%, a difference of 0.16%), Native Hawaiian (43.1%, a difference of 0.50%), and Trinidadian and Tobagonian (43.6%, a difference of 0.60%).
| Demographics | Rating | Rank | Associate's Degree |
| Barbadians | 5.8 /100 | #222 | Tragic 43.9% |
| Sub-Saharan Africans | 5.5 /100 | #223 | Tragic 43.9% |
| West Indians | 5.2 /100 | #224 | Tragic 43.8% |
| Guamanians/Chamorros | 4.8 /100 | #225 | Tragic 43.8% |
| Immigrants | Burma/Myanmar | 4.3 /100 | #226 | Tragic 43.7% |
| Trinidadians and Tobagonians | 4.0 /100 | #227 | Tragic 43.6% |
| Hmong | 3.2 /100 | #228 | Tragic 43.4% |
| Immigrants | Trinidad and Tobago | 3.0 /100 | #229 | Tragic 43.3% |
| Immigrants | Barbados | 2.9 /100 | #230 | Tragic 43.3% |
| Liberians | 2.9 /100 | #231 | Tragic 43.3% |
| Native Hawaiians | 2.3 /100 | #232 | Tragic 43.1% |
| Tongans | 2.2 /100 | #233 | Tragic 43.0% |
| Tlingit-Haida | 2.1 /100 | #234 | Tragic 43.0% |
| Ecuadorians | 2.0 /100 | #235 | Tragic 43.0% |
| Immigrants | St. Vincent and the Grenadines | 1.9 /100 | #236 | Tragic 42.9% |
Demographics Similar to Lithuanians by Associate's Degree
In terms of associate's degree, the demographic groups most similar to Lithuanians are Immigrants from Scotland (50.6%, a difference of 0.040%), Carpatho Rusyn (50.6%, a difference of 0.060%), Immigrants from Zimbabwe (50.5%, a difference of 0.25%), Immigrants from Lebanon (50.5%, a difference of 0.28%), and Immigrants from Eastern Europe (50.5%, a difference of 0.33%).
| Demographics | Rating | Rank | Associate's Degree |
| Argentineans | 99.6 /100 | #67 | Exceptional 51.2% |
| Immigrants | Indonesia | 99.5 /100 | #68 | Exceptional 51.0% |
| Egyptians | 99.5 /100 | #69 | Exceptional 50.9% |
| Immigrants | Argentina | 99.5 /100 | #70 | Exceptional 50.9% |
| Immigrants | Romania | 99.5 /100 | #71 | Exceptional 50.9% |
| Immigrants | Pakistan | 99.5 /100 | #72 | Exceptional 50.9% |
| Carpatho Rusyns | 99.3 /100 | #73 | Exceptional 50.6% |
| Lithuanians | 99.3 /100 | #74 | Exceptional 50.6% |
| Immigrants | Scotland | 99.3 /100 | #75 | Exceptional 50.6% |
| Immigrants | Zimbabwe | 99.2 /100 | #76 | Exceptional 50.5% |
| Immigrants | Lebanon | 99.1 /100 | #77 | Exceptional 50.5% |
| Immigrants | Eastern Europe | 99.1 /100 | #78 | Exceptional 50.5% |
| Ethiopians | 99.1 /100 | #79 | Exceptional 50.4% |
| Armenians | 99.1 /100 | #80 | Exceptional 50.4% |
| Maltese | 99.1 /100 | #81 | Exceptional 50.4% |