Black/African American vs Lithuanian Married-couple Households
COMPARE
Black/African American
Lithuanian
Married-couple Households
Married-couple Households Comparison
Blacks/African Americans
Lithuanians
38.5%
MARRIED-COUPLE HOUSEHOLDS
0.0/ 100
METRIC RATING
336th/ 347
METRIC RANK
48.9%
MARRIED-COUPLE HOUSEHOLDS
99.6/ 100
METRIC RATING
39th/ 347
METRIC RANK
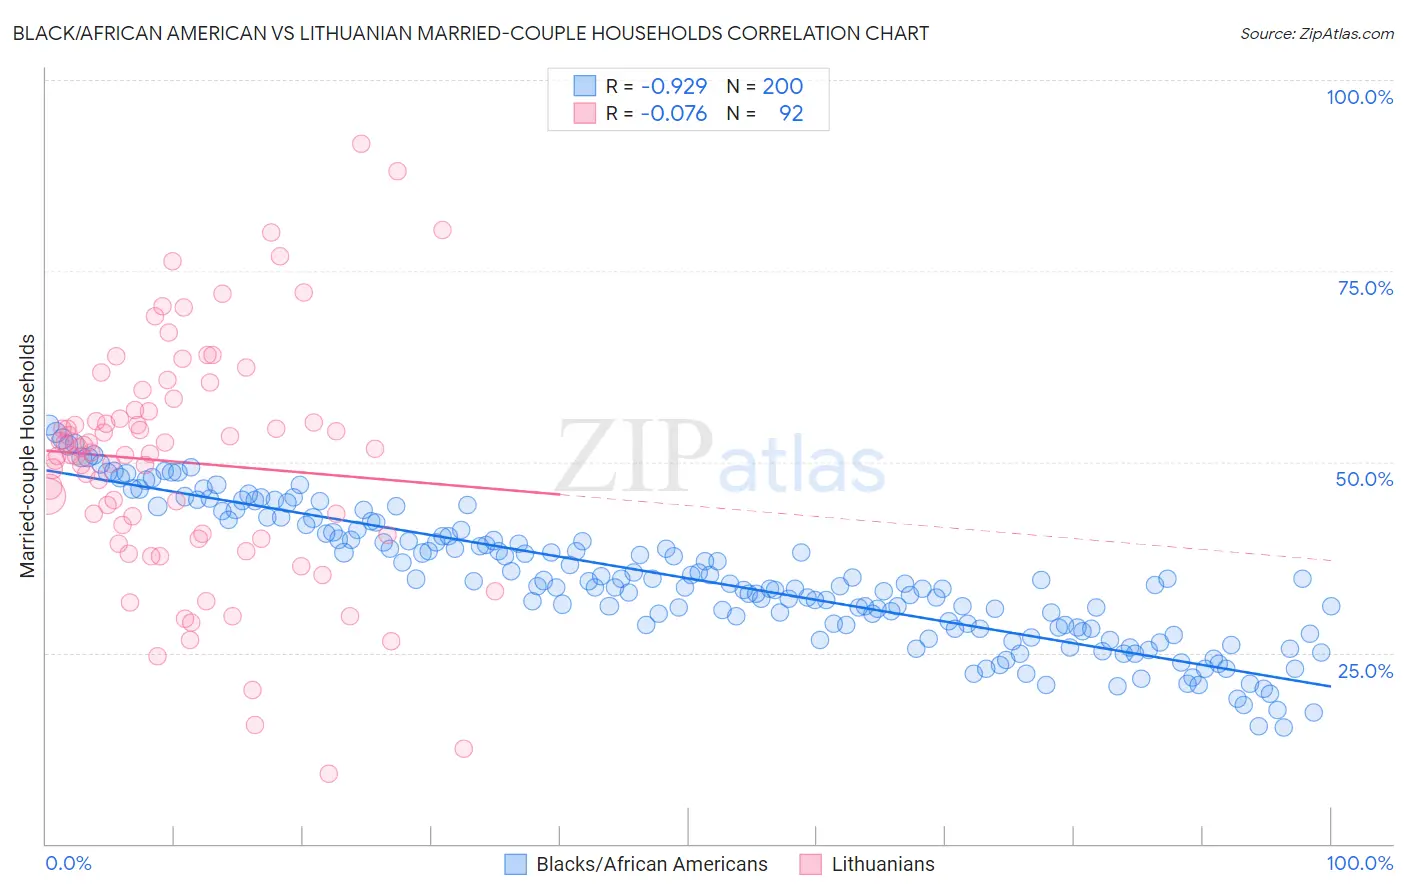
Black/African American vs Lithuanian Married-couple Households Correlation Chart
The statistical analysis conducted on geographies consisting of 565,301,242 people shows a near-perfect negative correlation between the proportion of Blacks/African Americans and percentage of married-couple family households in the United States with a correlation coefficient (R) of -0.929 and weighted average of 38.5%. Similarly, the statistical analysis conducted on geographies consisting of 421,720,983 people shows a slight negative correlation between the proportion of Lithuanians and percentage of married-couple family households in the United States with a correlation coefficient (R) of -0.076 and weighted average of 48.9%, a difference of 27.0%.
Married-couple Households Correlation Summary
| Measurement | Black/African American | Lithuanian |
| Minimum | 15.3% | 9.2% |
| Maximum | 54.8% | 91.7% |
| Range | 39.5% | 82.5% |
| Mean | 34.7% | 49.9% |
| Median | 34.0% | 51.1% |
| Interquartile 25% (IQ1) | 28.3% | 40.2% |
| Interquartile 75% (IQ3) | 41.0% | 56.7% |
| Interquartile Range (IQR) | 12.7% | 16.5% |
| Standard Deviation (Sample) | 8.8% | 15.6% |
| Standard Deviation (Population) | 8.8% | 15.5% |
Similar Demographics by Married-couple Households
Demographics Similar to Blacks/African Americans by Married-couple Households
In terms of married-couple households, the demographic groups most similar to Blacks/African Americans are Immigrants from Somalia (38.4%, a difference of 0.14%), Senegalese (38.6%, a difference of 0.18%), Immigrants from Senegal (38.4%, a difference of 0.30%), British West Indian (38.3%, a difference of 0.43%), and Immigrants from St. Vincent and the Grenadines (38.7%, a difference of 0.51%).
| Demographics | Rating | Rank | Married-couple Households |
| Immigrants | Dominica | 0.0 /100 | #329 | Tragic 39.4% |
| Immigrants | Barbados | 0.0 /100 | #330 | Tragic 39.2% |
| Immigrants | Congo | 0.0 /100 | #331 | Tragic 39.0% |
| Somalis | 0.0 /100 | #332 | Tragic 39.0% |
| Immigrants | West Indies | 0.0 /100 | #333 | Tragic 39.0% |
| Immigrants | St. Vincent and the Grenadines | 0.0 /100 | #334 | Tragic 38.7% |
| Senegalese | 0.0 /100 | #335 | Tragic 38.6% |
| Blacks/African Americans | 0.0 /100 | #336 | Tragic 38.5% |
| Immigrants | Somalia | 0.0 /100 | #337 | Tragic 38.4% |
| Immigrants | Senegal | 0.0 /100 | #338 | Tragic 38.4% |
| British West Indians | 0.0 /100 | #339 | Tragic 38.3% |
| Dominicans | 0.0 /100 | #340 | Tragic 38.2% |
| Cape Verdeans | 0.0 /100 | #341 | Tragic 38.1% |
| Tohono O'odham | 0.0 /100 | #342 | Tragic 37.9% |
| Immigrants | Grenada | 0.0 /100 | #343 | Tragic 37.5% |
Demographics Similar to Lithuanians by Married-couple Households
In terms of married-couple households, the demographic groups most similar to Lithuanians are Immigrants from Bolivia (48.9%, a difference of 0.010%), Immigrants from Lebanon (48.9%, a difference of 0.050%), Greek (48.9%, a difference of 0.080%), Immigrants from Vietnam (48.8%, a difference of 0.090%), and Immigrants from Iran (48.8%, a difference of 0.15%).
| Demographics | Rating | Rank | Married-couple Households |
| Hungarians | 99.8 /100 | #32 | Exceptional 49.1% |
| Immigrants | Asia | 99.7 /100 | #33 | Exceptional 49.1% |
| Italians | 99.7 /100 | #34 | Exceptional 49.0% |
| Scottish | 99.7 /100 | #35 | Exceptional 49.0% |
| Iranians | 99.7 /100 | #36 | Exceptional 49.0% |
| Sri Lankans | 99.7 /100 | #37 | Exceptional 49.0% |
| Greeks | 99.7 /100 | #38 | Exceptional 48.9% |
| Lithuanians | 99.6 /100 | #39 | Exceptional 48.9% |
| Immigrants | Bolivia | 99.6 /100 | #40 | Exceptional 48.9% |
| Immigrants | Lebanon | 99.6 /100 | #41 | Exceptional 48.9% |
| Immigrants | Vietnam | 99.6 /100 | #42 | Exceptional 48.8% |
| Immigrants | Iran | 99.6 /100 | #43 | Exceptional 48.8% |
| Welsh | 99.5 /100 | #44 | Exceptional 48.8% |
| Immigrants | Eastern Asia | 99.5 /100 | #45 | Exceptional 48.8% |
| Tsimshian | 99.5 /100 | #46 | Exceptional 48.7% |