Soviet Union vs Lithuanian Married-couple Households
COMPARE
Soviet Union
Lithuanian
Married-couple Households
Married-couple Households Comparison
Soviet Union
Lithuanians
44.6%
MARRIED-COUPLE HOUSEHOLDS
1.6/ 100
METRIC RATING
230th/ 347
METRIC RANK
48.9%
MARRIED-COUPLE HOUSEHOLDS
99.6/ 100
METRIC RATING
39th/ 347
METRIC RANK
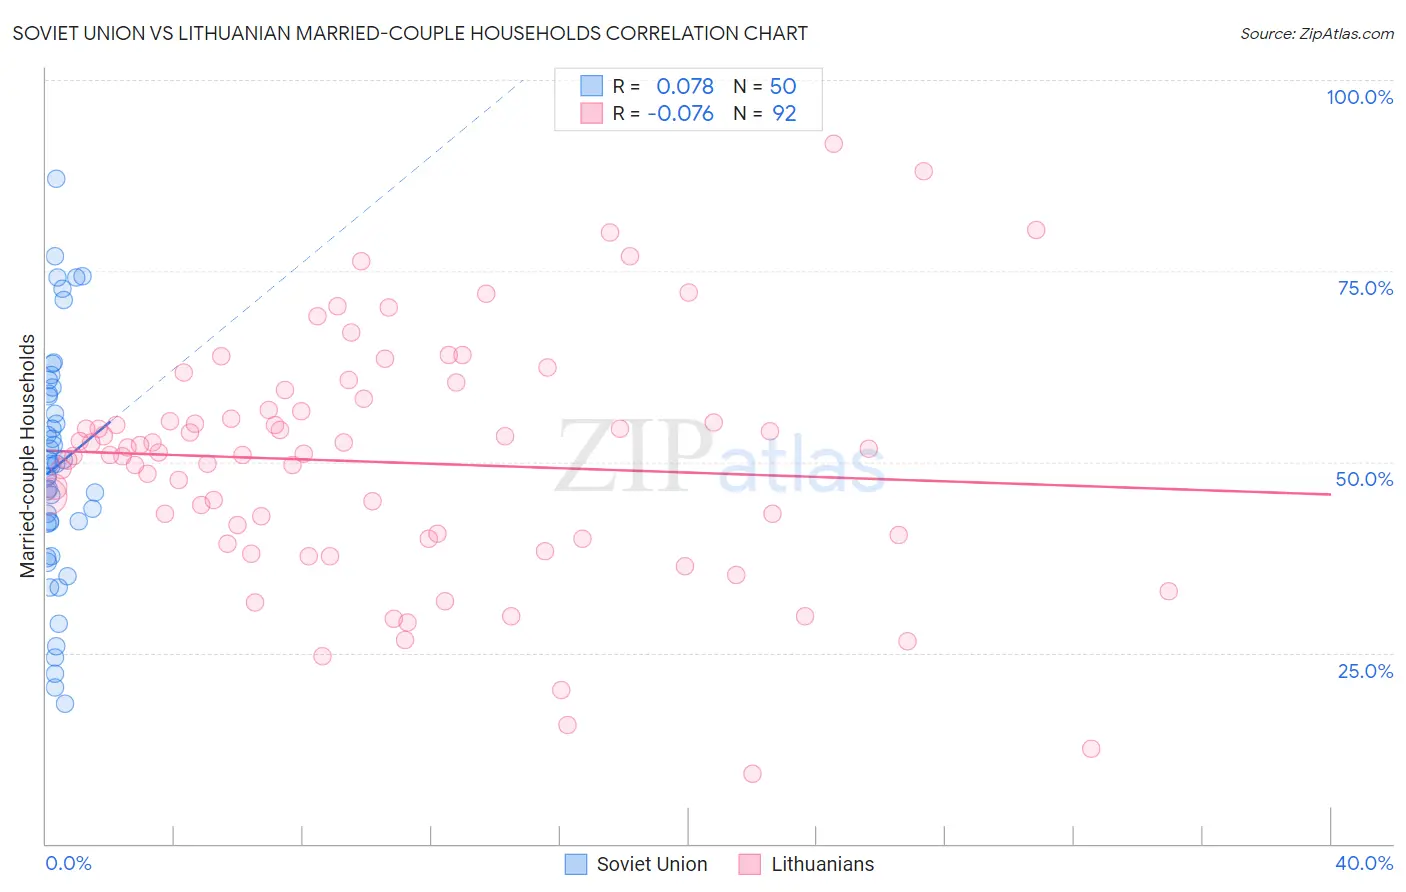
Soviet Union vs Lithuanian Married-couple Households Correlation Chart
The statistical analysis conducted on geographies consisting of 43,509,630 people shows a slight positive correlation between the proportion of Soviet Union and percentage of married-couple family households in the United States with a correlation coefficient (R) of 0.078 and weighted average of 44.6%. Similarly, the statistical analysis conducted on geographies consisting of 421,720,983 people shows a slight negative correlation between the proportion of Lithuanians and percentage of married-couple family households in the United States with a correlation coefficient (R) of -0.076 and weighted average of 48.9%, a difference of 9.5%.
Married-couple Households Correlation Summary
| Measurement | Soviet Union | Lithuanian |
| Minimum | 18.4% | 9.2% |
| Maximum | 87.0% | 91.7% |
| Range | 68.6% | 82.5% |
| Mean | 49.4% | 49.9% |
| Median | 49.6% | 51.1% |
| Interquartile 25% (IQ1) | 41.9% | 40.2% |
| Interquartile 75% (IQ3) | 58.9% | 56.7% |
| Interquartile Range (IQR) | 17.0% | 16.5% |
| Standard Deviation (Sample) | 15.5% | 15.6% |
| Standard Deviation (Population) | 15.3% | 15.5% |
Similar Demographics by Married-couple Households
Demographics Similar to Soviet Union by Married-couple Households
In terms of married-couple households, the demographic groups most similar to Soviet Union are Houma (44.6%, a difference of 0.010%), Marshallese (44.6%, a difference of 0.010%), Immigrants from Latin America (44.7%, a difference of 0.040%), Immigrants from Uganda (44.6%, a difference of 0.050%), and Kenyan (44.7%, a difference of 0.090%).
| Demographics | Rating | Rank | Married-couple Households |
| Immigrants | Cambodia | 2.7 /100 | #223 | Tragic 44.9% |
| Immigrants | Micronesia | 2.6 /100 | #224 | Tragic 44.9% |
| Dutch West Indians | 2.6 /100 | #225 | Tragic 44.9% |
| Alsatians | 2.3 /100 | #226 | Tragic 44.8% |
| Salvadorans | 1.9 /100 | #227 | Tragic 44.7% |
| Kenyans | 1.7 /100 | #228 | Tragic 44.7% |
| Immigrants | Latin America | 1.6 /100 | #229 | Tragic 44.7% |
| Soviet Union | 1.6 /100 | #230 | Tragic 44.6% |
| Houma | 1.5 /100 | #231 | Tragic 44.6% |
| Marshallese | 1.5 /100 | #232 | Tragic 44.6% |
| Immigrants | Uganda | 1.5 /100 | #233 | Tragic 44.6% |
| Immigrants | Panama | 1.3 /100 | #234 | Tragic 44.6% |
| Immigrants | Nicaragua | 1.2 /100 | #235 | Tragic 44.5% |
| Yaqui | 1.2 /100 | #236 | Tragic 44.5% |
| Comanche | 1.2 /100 | #237 | Tragic 44.5% |
Demographics Similar to Lithuanians by Married-couple Households
In terms of married-couple households, the demographic groups most similar to Lithuanians are Immigrants from Bolivia (48.9%, a difference of 0.010%), Immigrants from Lebanon (48.9%, a difference of 0.050%), Greek (48.9%, a difference of 0.080%), Immigrants from Vietnam (48.8%, a difference of 0.090%), and Immigrants from Iran (48.8%, a difference of 0.15%).
| Demographics | Rating | Rank | Married-couple Households |
| Hungarians | 99.8 /100 | #32 | Exceptional 49.1% |
| Immigrants | Asia | 99.7 /100 | #33 | Exceptional 49.1% |
| Italians | 99.7 /100 | #34 | Exceptional 49.0% |
| Scottish | 99.7 /100 | #35 | Exceptional 49.0% |
| Iranians | 99.7 /100 | #36 | Exceptional 49.0% |
| Sri Lankans | 99.7 /100 | #37 | Exceptional 49.0% |
| Greeks | 99.7 /100 | #38 | Exceptional 48.9% |
| Lithuanians | 99.6 /100 | #39 | Exceptional 48.9% |
| Immigrants | Bolivia | 99.6 /100 | #40 | Exceptional 48.9% |
| Immigrants | Lebanon | 99.6 /100 | #41 | Exceptional 48.9% |
| Immigrants | Vietnam | 99.6 /100 | #42 | Exceptional 48.8% |
| Immigrants | Iran | 99.6 /100 | #43 | Exceptional 48.8% |
| Welsh | 99.5 /100 | #44 | Exceptional 48.8% |
| Immigrants | Eastern Asia | 99.5 /100 | #45 | Exceptional 48.8% |
| Tsimshian | 99.5 /100 | #46 | Exceptional 48.7% |