Immigrants from Morocco vs Black/African American Married-couple Households
COMPARE
Immigrants from Morocco
Black/African American
Married-couple Households
Married-couple Households Comparison
Immigrants from Morocco
Blacks/African Americans
44.2%
MARRIED-COUPLE HOUSEHOLDS
0.6/ 100
METRIC RATING
247th/ 347
METRIC RANK
38.5%
MARRIED-COUPLE HOUSEHOLDS
0.0/ 100
METRIC RATING
336th/ 347
METRIC RANK
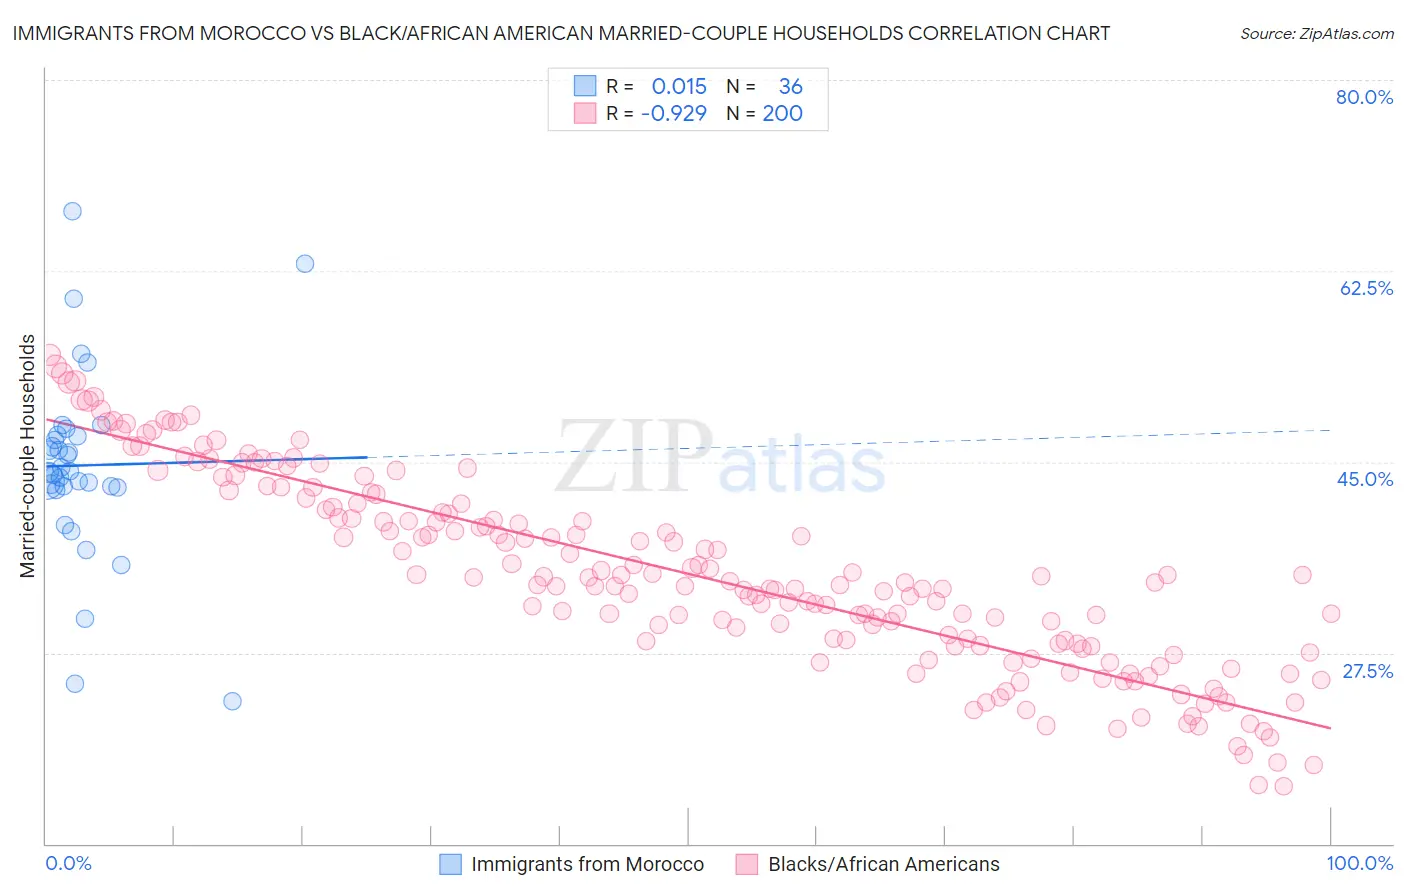
Immigrants from Morocco vs Black/African American Married-couple Households Correlation Chart
The statistical analysis conducted on geographies consisting of 178,909,382 people shows no correlation between the proportion of Immigrants from Morocco and percentage of married-couple family households in the United States with a correlation coefficient (R) of 0.015 and weighted average of 44.2%. Similarly, the statistical analysis conducted on geographies consisting of 565,301,242 people shows a near-perfect negative correlation between the proportion of Blacks/African Americans and percentage of married-couple family households in the United States with a correlation coefficient (R) of -0.929 and weighted average of 38.5%, a difference of 14.8%.
Married-couple Households Correlation Summary
| Measurement | Immigrants from Morocco | Black/African American |
| Minimum | 23.0% | 15.3% |
| Maximum | 68.0% | 54.8% |
| Range | 44.9% | 39.5% |
| Mean | 44.7% | 34.7% |
| Median | 44.1% | 34.0% |
| Interquartile 25% (IQ1) | 42.7% | 28.3% |
| Interquartile 75% (IQ3) | 47.4% | 41.0% |
| Interquartile Range (IQR) | 4.7% | 12.7% |
| Standard Deviation (Sample) | 8.8% | 8.8% |
| Standard Deviation (Population) | 8.6% | 8.8% |
Similar Demographics by Married-couple Households
Demographics Similar to Immigrants from Morocco by Married-couple Households
In terms of married-couple households, the demographic groups most similar to Immigrants from Morocco are Immigrants from Cuba (44.2%, a difference of 0.0%), Immigrants from El Salvador (44.3%, a difference of 0.15%), Immigrants from Armenia (44.3%, a difference of 0.16%), Yup'ik (44.1%, a difference of 0.28%), and Immigrants from Kenya (44.1%, a difference of 0.32%).
| Demographics | Rating | Rank | Married-couple Households |
| Ute | 1.0 /100 | #240 | Tragic 44.4% |
| Immigrants | Bosnia and Herzegovina | 1.0 /100 | #241 | Tragic 44.4% |
| Immigrants | Albania | 1.0 /100 | #242 | Tragic 44.4% |
| Immigrants | Saudi Arabia | 0.9 /100 | #243 | Tragic 44.4% |
| Immigrants | Armenia | 0.7 /100 | #244 | Tragic 44.3% |
| Immigrants | El Salvador | 0.7 /100 | #245 | Tragic 44.3% |
| Immigrants | Cuba | 0.6 /100 | #246 | Tragic 44.2% |
| Immigrants | Morocco | 0.6 /100 | #247 | Tragic 44.2% |
| Yup'ik | 0.4 /100 | #248 | Tragic 44.1% |
| Immigrants | Kenya | 0.4 /100 | #249 | Tragic 44.1% |
| French American Indians | 0.4 /100 | #250 | Tragic 44.1% |
| German Russians | 0.4 /100 | #251 | Tragic 44.0% |
| Seminole | 0.4 /100 | #252 | Tragic 44.0% |
| Central Americans | 0.3 /100 | #253 | Tragic 43.9% |
| Apache | 0.3 /100 | #254 | Tragic 43.9% |
Demographics Similar to Blacks/African Americans by Married-couple Households
In terms of married-couple households, the demographic groups most similar to Blacks/African Americans are Immigrants from Somalia (38.4%, a difference of 0.14%), Senegalese (38.6%, a difference of 0.18%), Immigrants from Senegal (38.4%, a difference of 0.30%), British West Indian (38.3%, a difference of 0.43%), and Immigrants from St. Vincent and the Grenadines (38.7%, a difference of 0.51%).
| Demographics | Rating | Rank | Married-couple Households |
| Immigrants | Dominica | 0.0 /100 | #329 | Tragic 39.4% |
| Immigrants | Barbados | 0.0 /100 | #330 | Tragic 39.2% |
| Immigrants | Congo | 0.0 /100 | #331 | Tragic 39.0% |
| Somalis | 0.0 /100 | #332 | Tragic 39.0% |
| Immigrants | West Indies | 0.0 /100 | #333 | Tragic 39.0% |
| Immigrants | St. Vincent and the Grenadines | 0.0 /100 | #334 | Tragic 38.7% |
| Senegalese | 0.0 /100 | #335 | Tragic 38.6% |
| Blacks/African Americans | 0.0 /100 | #336 | Tragic 38.5% |
| Immigrants | Somalia | 0.0 /100 | #337 | Tragic 38.4% |
| Immigrants | Senegal | 0.0 /100 | #338 | Tragic 38.4% |
| British West Indians | 0.0 /100 | #339 | Tragic 38.3% |
| Dominicans | 0.0 /100 | #340 | Tragic 38.2% |
| Cape Verdeans | 0.0 /100 | #341 | Tragic 38.1% |
| Tohono O'odham | 0.0 /100 | #342 | Tragic 37.9% |
| Immigrants | Grenada | 0.0 /100 | #343 | Tragic 37.5% |