Immigrants from Morocco vs Argentinean Married-couple Households
COMPARE
Immigrants from Morocco
Argentinean
Married-couple Households
Married-couple Households Comparison
Immigrants from Morocco
Argentineans
44.2%
MARRIED-COUPLE HOUSEHOLDS
0.6/ 100
METRIC RATING
247th/ 347
METRIC RANK
47.5%
MARRIED-COUPLE HOUSEHOLDS
92.5/ 100
METRIC RATING
116th/ 347
METRIC RANK
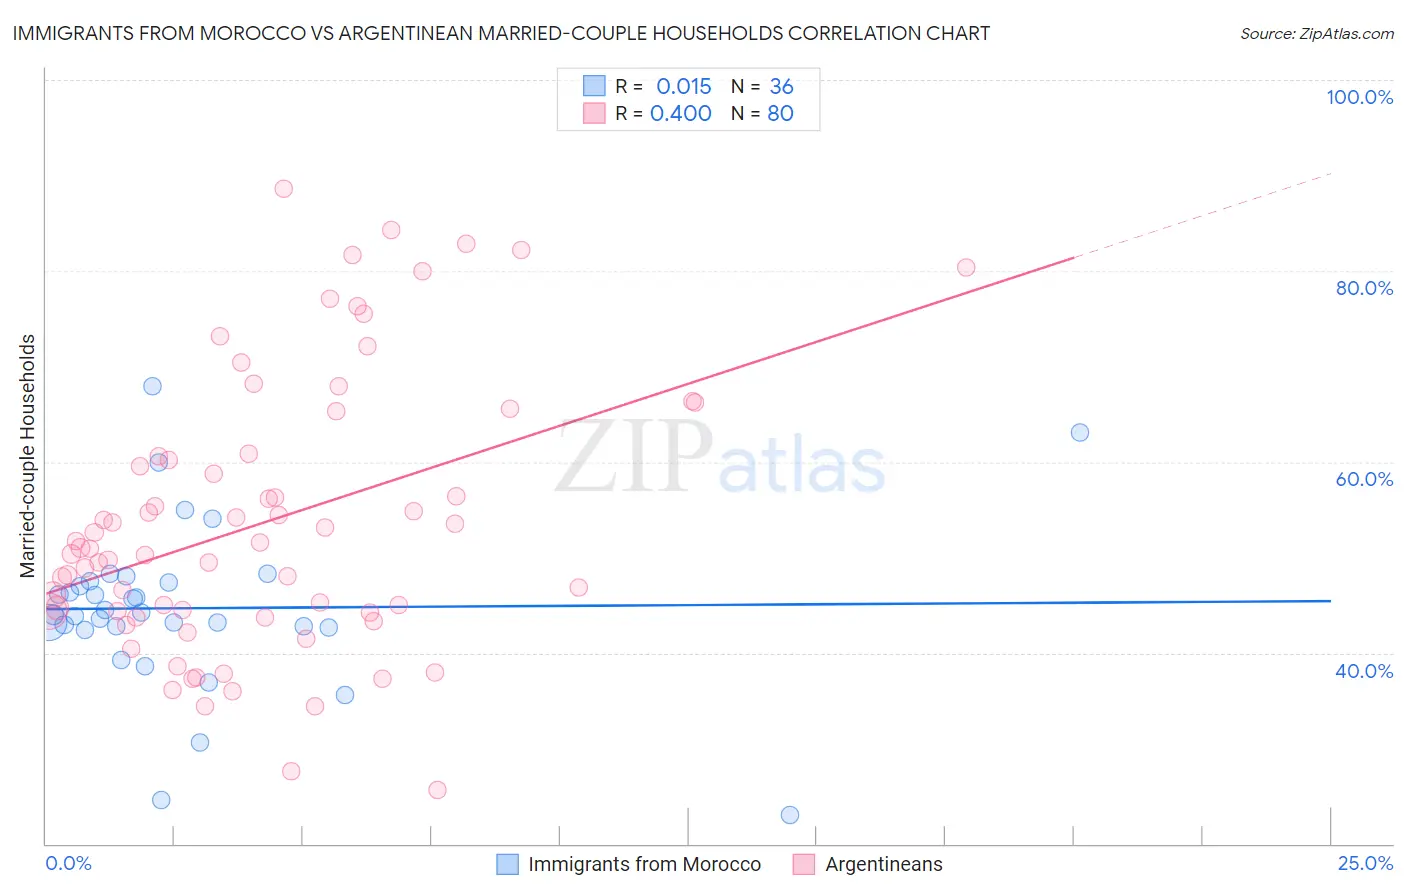
Immigrants from Morocco vs Argentinean Married-couple Households Correlation Chart
The statistical analysis conducted on geographies consisting of 178,909,382 people shows no correlation between the proportion of Immigrants from Morocco and percentage of married-couple family households in the United States with a correlation coefficient (R) of 0.015 and weighted average of 44.2%. Similarly, the statistical analysis conducted on geographies consisting of 296,995,795 people shows a mild positive correlation between the proportion of Argentineans and percentage of married-couple family households in the United States with a correlation coefficient (R) of 0.400 and weighted average of 47.5%, a difference of 7.6%.
Married-couple Households Correlation Summary
| Measurement | Immigrants from Morocco | Argentinean |
| Minimum | 23.0% | 25.6% |
| Maximum | 68.0% | 88.5% |
| Range | 44.9% | 62.9% |
| Mean | 44.7% | 53.7% |
| Median | 44.1% | 51.0% |
| Interquartile 25% (IQ1) | 42.7% | 44.3% |
| Interquartile 75% (IQ3) | 47.4% | 60.7% |
| Interquartile Range (IQR) | 4.7% | 16.4% |
| Standard Deviation (Sample) | 8.8% | 14.3% |
| Standard Deviation (Population) | 8.6% | 14.2% |
Similar Demographics by Married-couple Households
Demographics Similar to Immigrants from Morocco by Married-couple Households
In terms of married-couple households, the demographic groups most similar to Immigrants from Morocco are Immigrants from Cuba (44.2%, a difference of 0.0%), Immigrants from El Salvador (44.3%, a difference of 0.15%), Immigrants from Armenia (44.3%, a difference of 0.16%), Yup'ik (44.1%, a difference of 0.28%), and Immigrants from Kenya (44.1%, a difference of 0.32%).
| Demographics | Rating | Rank | Married-couple Households |
| Ute | 1.0 /100 | #240 | Tragic 44.4% |
| Immigrants | Bosnia and Herzegovina | 1.0 /100 | #241 | Tragic 44.4% |
| Immigrants | Albania | 1.0 /100 | #242 | Tragic 44.4% |
| Immigrants | Saudi Arabia | 0.9 /100 | #243 | Tragic 44.4% |
| Immigrants | Armenia | 0.7 /100 | #244 | Tragic 44.3% |
| Immigrants | El Salvador | 0.7 /100 | #245 | Tragic 44.3% |
| Immigrants | Cuba | 0.6 /100 | #246 | Tragic 44.2% |
| Immigrants | Morocco | 0.6 /100 | #247 | Tragic 44.2% |
| Yup'ik | 0.4 /100 | #248 | Tragic 44.1% |
| Immigrants | Kenya | 0.4 /100 | #249 | Tragic 44.1% |
| French American Indians | 0.4 /100 | #250 | Tragic 44.1% |
| German Russians | 0.4 /100 | #251 | Tragic 44.0% |
| Seminole | 0.4 /100 | #252 | Tragic 44.0% |
| Central Americans | 0.3 /100 | #253 | Tragic 43.9% |
| Apache | 0.3 /100 | #254 | Tragic 43.9% |
Demographics Similar to Argentineans by Married-couple Households
In terms of married-couple households, the demographic groups most similar to Argentineans are French Canadian (47.5%, a difference of 0.010%), Immigrants from Germany (47.5%, a difference of 0.020%), Slovak (47.6%, a difference of 0.050%), Chilean (47.5%, a difference of 0.050%), and Immigrants from Europe (47.6%, a difference of 0.17%).
| Demographics | Rating | Rank | Married-couple Households |
| Immigrants | Jordan | 94.1 /100 | #109 | Exceptional 47.7% |
| Macedonians | 93.9 /100 | #110 | Exceptional 47.6% |
| Syrians | 93.9 /100 | #111 | Exceptional 47.6% |
| Peruvians | 93.8 /100 | #112 | Exceptional 47.6% |
| Venezuelans | 93.8 /100 | #113 | Exceptional 47.6% |
| Immigrants | Europe | 93.7 /100 | #114 | Exceptional 47.6% |
| Slovaks | 92.9 /100 | #115 | Exceptional 47.6% |
| Argentineans | 92.5 /100 | #116 | Exceptional 47.5% |
| French Canadians | 92.4 /100 | #117 | Exceptional 47.5% |
| Immigrants | Germany | 92.4 /100 | #118 | Exceptional 47.5% |
| Chileans | 92.2 /100 | #119 | Exceptional 47.5% |
| Puget Sound Salish | 90.5 /100 | #120 | Exceptional 47.4% |
| Immigrants | Eastern Europe | 90.3 /100 | #121 | Exceptional 47.4% |
| Okinawans | 90.1 /100 | #122 | Exceptional 47.4% |
| Immigrants | Venezuela | 89.3 /100 | #123 | Excellent 47.4% |