European vs Immigrants from Barbados Births to Unmarried Women
COMPARE
European
Immigrants from Barbados
Births to Unmarried Women
Births to Unmarried Women Comparison
Europeans
Immigrants from Barbados
30.2%
BIRTHS TO UNMARRIED WOMEN
87.2/ 100
METRIC RATING
126th/ 347
METRIC RANK
36.8%
BIRTHS TO UNMARRIED WOMEN
0.1/ 100
METRIC RATING
271st/ 347
METRIC RANK
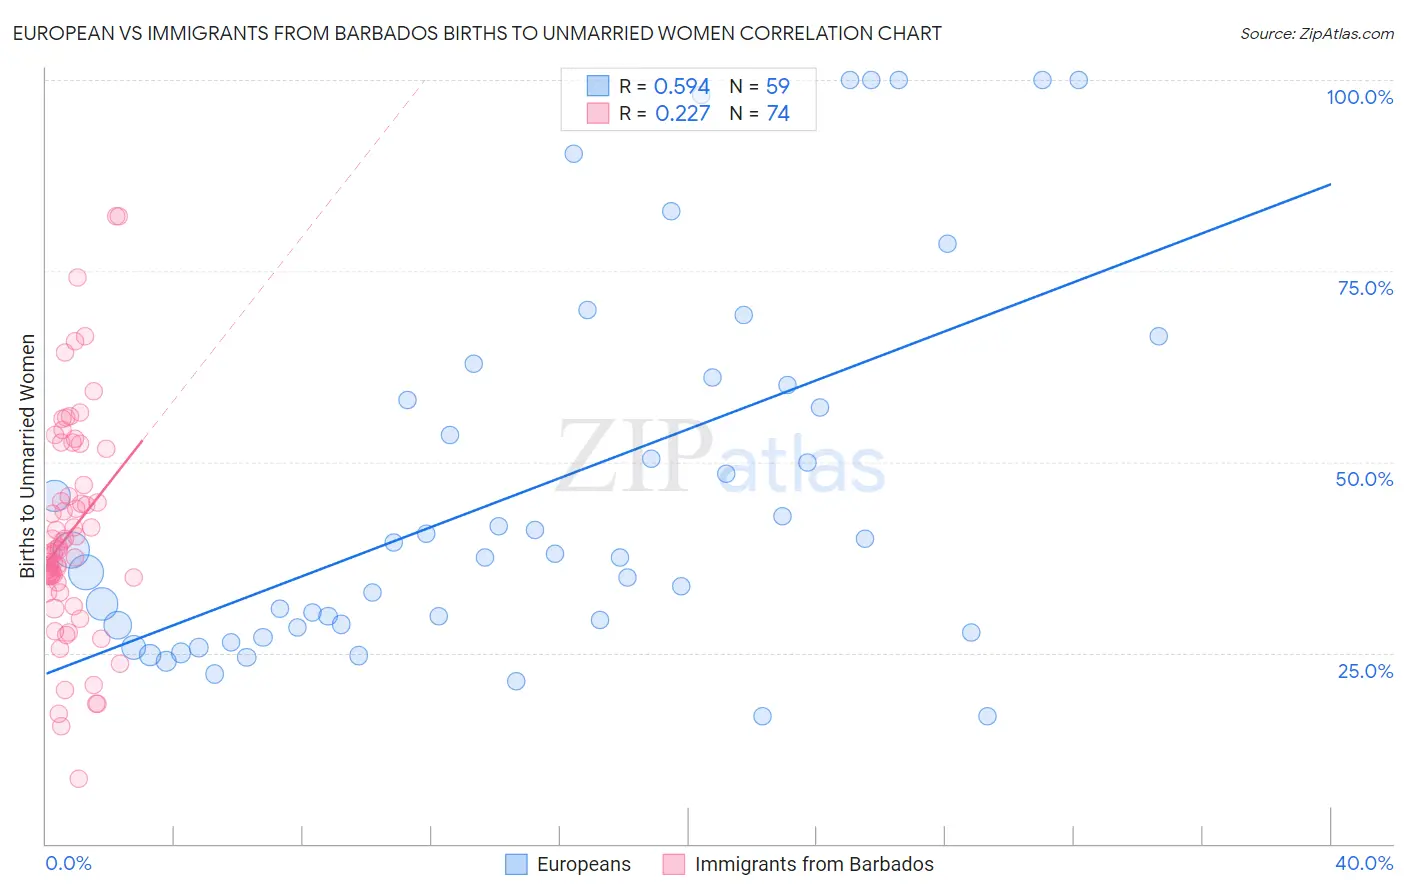
European vs Immigrants from Barbados Births to Unmarried Women Correlation Chart
The statistical analysis conducted on geographies consisting of 499,777,357 people shows a substantial positive correlation between the proportion of Europeans and percentage of births to unmarried women in the United States with a correlation coefficient (R) of 0.594 and weighted average of 30.2%. Similarly, the statistical analysis conducted on geographies consisting of 110,431,474 people shows a weak positive correlation between the proportion of Immigrants from Barbados and percentage of births to unmarried women in the United States with a correlation coefficient (R) of 0.227 and weighted average of 36.8%, a difference of 21.7%.
Births to Unmarried Women Correlation Summary
| Measurement | European | Immigrants from Barbados |
| Minimum | 16.7% | 8.5% |
| Maximum | 100.0% | 82.2% |
| Range | 83.3% | 73.7% |
| Mean | 46.4% | 40.7% |
| Median | 38.0% | 38.4% |
| Interquartile 25% (IQ1) | 28.3% | 34.3% |
| Interquartile 75% (IQ3) | 60.0% | 47.0% |
| Interquartile Range (IQR) | 31.7% | 12.7% |
| Standard Deviation (Sample) | 24.5% | 14.4% |
| Standard Deviation (Population) | 24.3% | 14.3% |
Similar Demographics by Births to Unmarried Women
Demographics Similar to Europeans by Births to Unmarried Women
In terms of births to unmarried women, the demographic groups most similar to Europeans are Chinese (30.2%, a difference of 0.030%), Vietnamese (30.2%, a difference of 0.12%), Croatian (30.2%, a difference of 0.19%), Syrian (30.2%, a difference of 0.23%), and Icelander (30.3%, a difference of 0.27%).
| Demographics | Rating | Rank | Births to Unmarried Women |
| Argentineans | 90.5 /100 | #119 | Exceptional 30.0% |
| Ugandans | 89.2 /100 | #120 | Excellent 30.1% |
| Koreans | 88.9 /100 | #121 | Excellent 30.1% |
| Immigrants | Argentina | 88.7 /100 | #122 | Excellent 30.1% |
| Syrians | 88.2 /100 | #123 | Excellent 30.2% |
| Croatians | 88.0 /100 | #124 | Excellent 30.2% |
| Vietnamese | 87.7 /100 | #125 | Excellent 30.2% |
| Europeans | 87.2 /100 | #126 | Excellent 30.2% |
| Chinese | 87.1 /100 | #127 | Excellent 30.2% |
| Icelanders | 86.0 /100 | #128 | Excellent 30.3% |
| Immigrants | Spain | 85.8 /100 | #129 | Excellent 30.3% |
| Immigrants | Bosnia and Herzegovina | 85.7 /100 | #130 | Excellent 30.3% |
| Immigrants | Zimbabwe | 85.7 /100 | #131 | Excellent 30.3% |
| New Zealanders | 85.5 /100 | #132 | Excellent 30.3% |
| Immigrants | Morocco | 85.2 /100 | #133 | Excellent 30.4% |
Demographics Similar to Immigrants from Barbados by Births to Unmarried Women
In terms of births to unmarried women, the demographic groups most similar to Immigrants from Barbados are Immigrants from Congo (36.8%, a difference of 0.030%), Senegalese (36.8%, a difference of 0.10%), Comanche (36.7%, a difference of 0.22%), Choctaw (36.9%, a difference of 0.22%), and Central American (36.7%, a difference of 0.23%).
| Demographics | Rating | Rank | Births to Unmarried Women |
| Sub-Saharan Africans | 0.1 /100 | #264 | Tragic 36.7% |
| Cherokee | 0.1 /100 | #265 | Tragic 36.7% |
| Immigrants | Senegal | 0.1 /100 | #266 | Tragic 36.7% |
| Central Americans | 0.1 /100 | #267 | Tragic 36.7% |
| Comanche | 0.1 /100 | #268 | Tragic 36.7% |
| Senegalese | 0.1 /100 | #269 | Tragic 36.8% |
| Immigrants | Congo | 0.1 /100 | #270 | Tragic 36.8% |
| Immigrants | Barbados | 0.1 /100 | #271 | Tragic 36.8% |
| Choctaw | 0.1 /100 | #272 | Tragic 36.9% |
| Mexicans | 0.1 /100 | #273 | Tragic 36.9% |
| Cree | 0.1 /100 | #274 | Tragic 37.0% |
| Barbadians | 0.1 /100 | #275 | Tragic 37.0% |
| Belizeans | 0.1 /100 | #276 | Tragic 37.0% |
| Guatemalans | 0.1 /100 | #277 | Tragic 37.1% |
| Immigrants | Latin America | 0.1 /100 | #278 | Tragic 37.1% |