European vs Immigrants from South America Births to Unmarried Women
COMPARE
European
Immigrants from South America
Births to Unmarried Women
Births to Unmarried Women Comparison
Europeans
Immigrants from South America
30.2%
BIRTHS TO UNMARRIED WOMEN
87.2/ 100
METRIC RATING
126th/ 347
METRIC RANK
32.0%
BIRTHS TO UNMARRIED WOMEN
40.7/ 100
METRIC RATING
184th/ 347
METRIC RANK
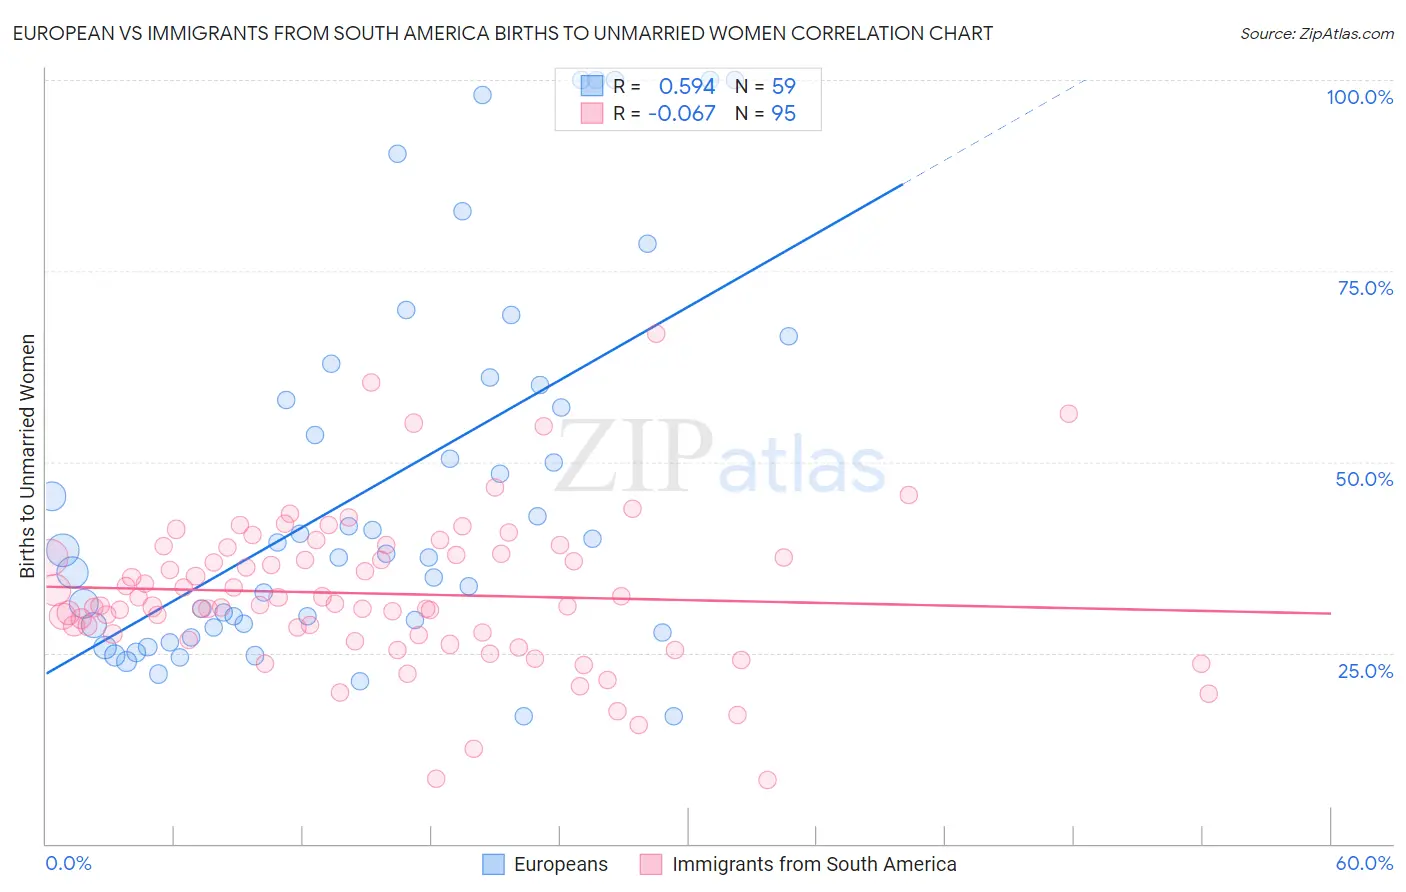
European vs Immigrants from South America Births to Unmarried Women Correlation Chart
The statistical analysis conducted on geographies consisting of 499,777,357 people shows a substantial positive correlation between the proportion of Europeans and percentage of births to unmarried women in the United States with a correlation coefficient (R) of 0.594 and weighted average of 30.2%. Similarly, the statistical analysis conducted on geographies consisting of 446,269,177 people shows a slight negative correlation between the proportion of Immigrants from South America and percentage of births to unmarried women in the United States with a correlation coefficient (R) of -0.067 and weighted average of 32.0%, a difference of 5.7%.
Births to Unmarried Women Correlation Summary
| Measurement | European | Immigrants from South America |
| Minimum | 16.7% | 8.4% |
| Maximum | 100.0% | 66.7% |
| Range | 83.3% | 58.3% |
| Mean | 46.4% | 32.7% |
| Median | 38.0% | 31.3% |
| Interquartile 25% (IQ1) | 28.3% | 27.4% |
| Interquartile 75% (IQ3) | 60.0% | 38.1% |
| Interquartile Range (IQR) | 31.7% | 10.6% |
| Standard Deviation (Sample) | 24.5% | 9.9% |
| Standard Deviation (Population) | 24.3% | 9.9% |
Similar Demographics by Births to Unmarried Women
Demographics Similar to Europeans by Births to Unmarried Women
In terms of births to unmarried women, the demographic groups most similar to Europeans are Chinese (30.2%, a difference of 0.030%), Vietnamese (30.2%, a difference of 0.12%), Croatian (30.2%, a difference of 0.19%), Syrian (30.2%, a difference of 0.23%), and Icelander (30.3%, a difference of 0.27%).
| Demographics | Rating | Rank | Births to Unmarried Women |
| Argentineans | 90.5 /100 | #119 | Exceptional 30.0% |
| Ugandans | 89.2 /100 | #120 | Excellent 30.1% |
| Koreans | 88.9 /100 | #121 | Excellent 30.1% |
| Immigrants | Argentina | 88.7 /100 | #122 | Excellent 30.1% |
| Syrians | 88.2 /100 | #123 | Excellent 30.2% |
| Croatians | 88.0 /100 | #124 | Excellent 30.2% |
| Vietnamese | 87.7 /100 | #125 | Excellent 30.2% |
| Europeans | 87.2 /100 | #126 | Excellent 30.2% |
| Chinese | 87.1 /100 | #127 | Excellent 30.2% |
| Icelanders | 86.0 /100 | #128 | Excellent 30.3% |
| Immigrants | Spain | 85.8 /100 | #129 | Excellent 30.3% |
| Immigrants | Bosnia and Herzegovina | 85.7 /100 | #130 | Excellent 30.3% |
| Immigrants | Zimbabwe | 85.7 /100 | #131 | Excellent 30.3% |
| New Zealanders | 85.5 /100 | #132 | Excellent 30.3% |
| Immigrants | Morocco | 85.2 /100 | #133 | Excellent 30.4% |
Demographics Similar to Immigrants from South America by Births to Unmarried Women
In terms of births to unmarried women, the demographic groups most similar to Immigrants from South America are Canadian (31.9%, a difference of 0.070%), German (32.0%, a difference of 0.11%), Kenyan (31.9%, a difference of 0.23%), Welsh (32.0%, a difference of 0.24%), and Czechoslovakian (32.0%, a difference of 0.26%).
| Demographics | Rating | Rank | Births to Unmarried Women |
| South American Indians | 47.7 /100 | #177 | Average 31.7% |
| English | 47.4 /100 | #178 | Average 31.7% |
| South Americans | 46.9 /100 | #179 | Average 31.8% |
| Moroccans | 45.7 /100 | #180 | Average 31.8% |
| Immigrants | Peru | 45.1 /100 | #181 | Average 31.8% |
| Kenyans | 43.0 /100 | #182 | Average 31.9% |
| Canadians | 41.4 /100 | #183 | Average 31.9% |
| Immigrants | South America | 40.7 /100 | #184 | Average 32.0% |
| Germans | 39.5 /100 | #185 | Fair 32.0% |
| Welsh | 38.2 /100 | #186 | Fair 32.0% |
| Czechoslovakians | 38.0 /100 | #187 | Fair 32.0% |
| Osage | 37.1 /100 | #188 | Fair 32.1% |
| Immigrants | Kenya | 36.9 /100 | #189 | Fair 32.1% |
| Tlingit-Haida | 32.6 /100 | #190 | Fair 32.2% |
| Irish | 32.4 /100 | #191 | Fair 32.2% |