European vs Immigrants from Czechoslovakia Births to Unmarried Women
COMPARE
European
Immigrants from Czechoslovakia
Births to Unmarried Women
Births to Unmarried Women Comparison
Europeans
Immigrants from Czechoslovakia
30.2%
BIRTHS TO UNMARRIED WOMEN
87.2/ 100
METRIC RATING
126th/ 347
METRIC RANK
28.4%
BIRTHS TO UNMARRIED WOMEN
98.8/ 100
METRIC RATING
65th/ 347
METRIC RANK
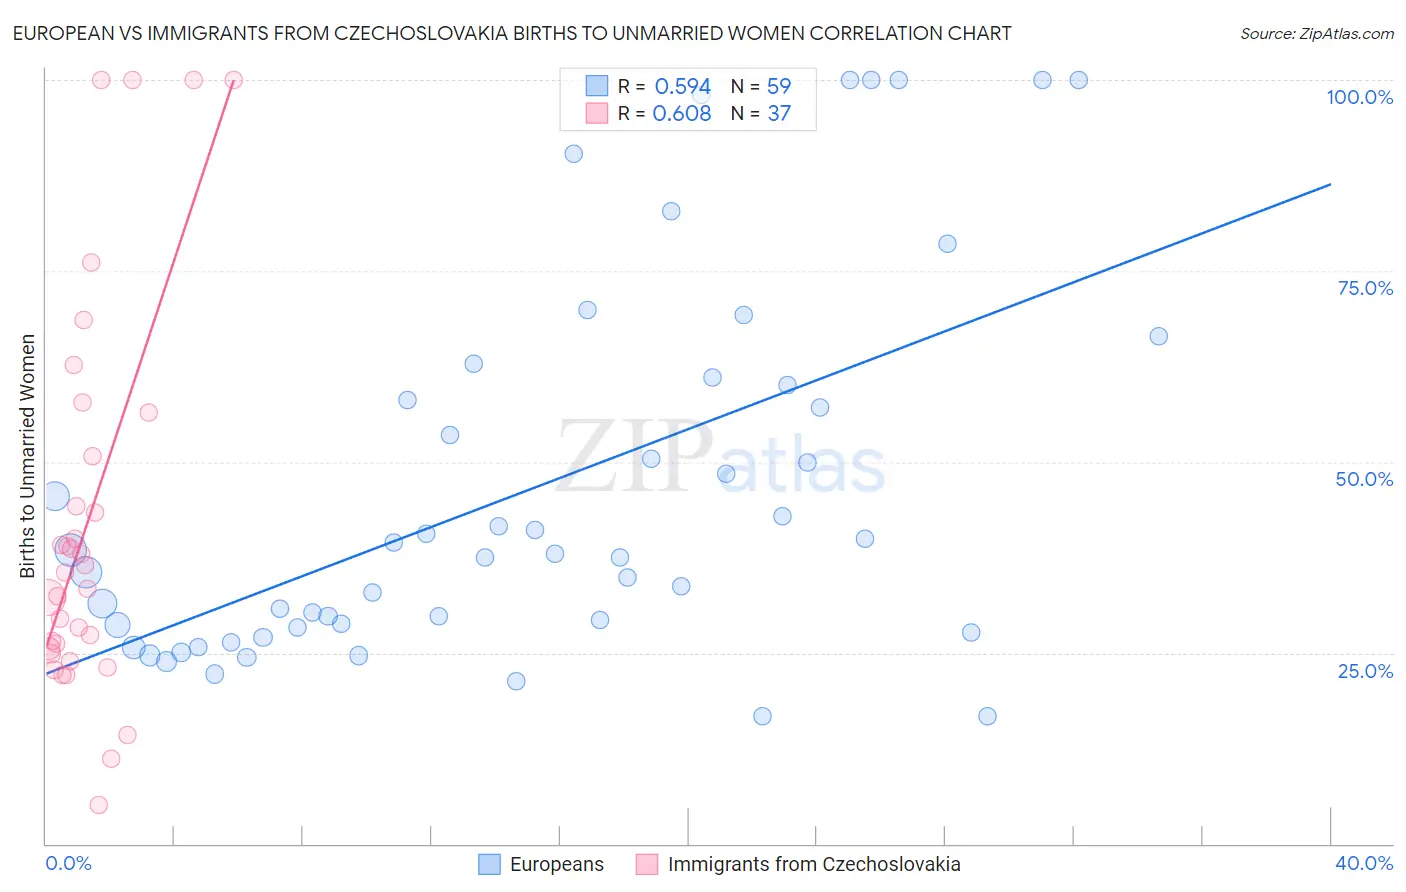
European vs Immigrants from Czechoslovakia Births to Unmarried Women Correlation Chart
The statistical analysis conducted on geographies consisting of 499,777,357 people shows a substantial positive correlation between the proportion of Europeans and percentage of births to unmarried women in the United States with a correlation coefficient (R) of 0.594 and weighted average of 30.2%. Similarly, the statistical analysis conducted on geographies consisting of 184,731,208 people shows a significant positive correlation between the proportion of Immigrants from Czechoslovakia and percentage of births to unmarried women in the United States with a correlation coefficient (R) of 0.608 and weighted average of 28.4%, a difference of 6.5%.
Births to Unmarried Women Correlation Summary
| Measurement | European | Immigrants from Czechoslovakia |
| Minimum | 16.7% | 5.1% |
| Maximum | 100.0% | 100.0% |
| Range | 83.3% | 94.9% |
| Mean | 46.4% | 42.1% |
| Median | 38.0% | 35.5% |
| Interquartile 25% (IQ1) | 28.3% | 25.2% |
| Interquartile 75% (IQ3) | 60.0% | 53.6% |
| Interquartile Range (IQR) | 31.7% | 28.5% |
| Standard Deviation (Sample) | 24.5% | 25.4% |
| Standard Deviation (Population) | 24.3% | 25.1% |
Similar Demographics by Births to Unmarried Women
Demographics Similar to Europeans by Births to Unmarried Women
In terms of births to unmarried women, the demographic groups most similar to Europeans are Chinese (30.2%, a difference of 0.030%), Vietnamese (30.2%, a difference of 0.12%), Croatian (30.2%, a difference of 0.19%), Syrian (30.2%, a difference of 0.23%), and Icelander (30.3%, a difference of 0.27%).
| Demographics | Rating | Rank | Births to Unmarried Women |
| Argentineans | 90.5 /100 | #119 | Exceptional 30.0% |
| Ugandans | 89.2 /100 | #120 | Excellent 30.1% |
| Koreans | 88.9 /100 | #121 | Excellent 30.1% |
| Immigrants | Argentina | 88.7 /100 | #122 | Excellent 30.1% |
| Syrians | 88.2 /100 | #123 | Excellent 30.2% |
| Croatians | 88.0 /100 | #124 | Excellent 30.2% |
| Vietnamese | 87.7 /100 | #125 | Excellent 30.2% |
| Europeans | 87.2 /100 | #126 | Excellent 30.2% |
| Chinese | 87.1 /100 | #127 | Excellent 30.2% |
| Icelanders | 86.0 /100 | #128 | Excellent 30.3% |
| Immigrants | Spain | 85.8 /100 | #129 | Excellent 30.3% |
| Immigrants | Bosnia and Herzegovina | 85.7 /100 | #130 | Excellent 30.3% |
| Immigrants | Zimbabwe | 85.7 /100 | #131 | Excellent 30.3% |
| New Zealanders | 85.5 /100 | #132 | Excellent 30.3% |
| Immigrants | Morocco | 85.2 /100 | #133 | Excellent 30.4% |
Demographics Similar to Immigrants from Czechoslovakia by Births to Unmarried Women
In terms of births to unmarried women, the demographic groups most similar to Immigrants from Czechoslovakia are Tongan (28.4%, a difference of 0.020%), Immigrants from Egypt (28.4%, a difference of 0.020%), Palestinian (28.4%, a difference of 0.13%), Immigrants from Europe (28.4%, a difference of 0.18%), and Bolivian (28.5%, a difference of 0.22%).
| Demographics | Rating | Rank | Births to Unmarried Women |
| Immigrants | Albania | 99.2 /100 | #58 | Exceptional 28.0% |
| Immigrants | Kazakhstan | 99.1 /100 | #59 | Exceptional 28.1% |
| Immigrants | Turkey | 99.1 /100 | #60 | Exceptional 28.1% |
| Immigrants | North Macedonia | 99.1 /100 | #61 | Exceptional 28.1% |
| Egyptians | 99.0 /100 | #62 | Exceptional 28.2% |
| Immigrants | Serbia | 98.9 /100 | #63 | Exceptional 28.3% |
| Tongans | 98.8 /100 | #64 | Exceptional 28.4% |
| Immigrants | Czechoslovakia | 98.8 /100 | #65 | Exceptional 28.4% |
| Immigrants | Egypt | 98.8 /100 | #66 | Exceptional 28.4% |
| Palestinians | 98.7 /100 | #67 | Exceptional 28.4% |
| Immigrants | Europe | 98.7 /100 | #68 | Exceptional 28.4% |
| Bolivians | 98.7 /100 | #69 | Exceptional 28.5% |
| Laotians | 98.6 /100 | #70 | Exceptional 28.5% |
| Jordanians | 98.5 /100 | #71 | Exceptional 28.5% |
| Immigrants | Sweden | 98.5 /100 | #72 | Exceptional 28.5% |