European vs Immigrants from Cuba Births to Unmarried Women
COMPARE
European
Immigrants from Cuba
Births to Unmarried Women
Births to Unmarried Women Comparison
Europeans
Immigrants from Cuba
30.2%
BIRTHS TO UNMARRIED WOMEN
87.2/ 100
METRIC RATING
126th/ 347
METRIC RANK
41.5%
BIRTHS TO UNMARRIED WOMEN
0.0/ 100
METRIC RATING
326th/ 347
METRIC RANK
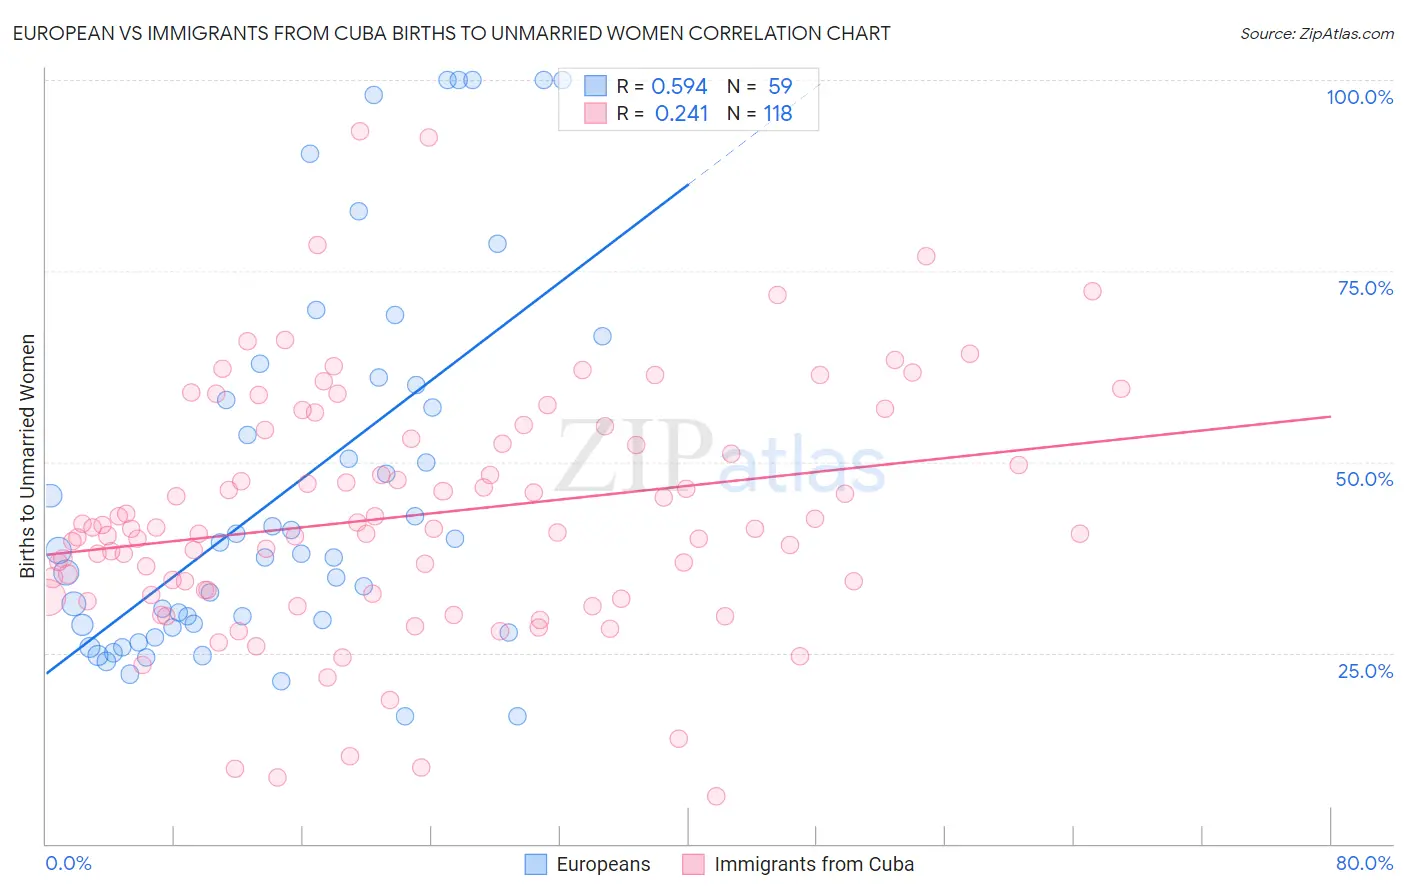
European vs Immigrants from Cuba Births to Unmarried Women Correlation Chart
The statistical analysis conducted on geographies consisting of 499,777,357 people shows a substantial positive correlation between the proportion of Europeans and percentage of births to unmarried women in the United States with a correlation coefficient (R) of 0.594 and weighted average of 30.2%. Similarly, the statistical analysis conducted on geographies consisting of 308,833,039 people shows a weak positive correlation between the proportion of Immigrants from Cuba and percentage of births to unmarried women in the United States with a correlation coefficient (R) of 0.241 and weighted average of 41.5%, a difference of 37.1%.
Births to Unmarried Women Correlation Summary
| Measurement | European | Immigrants from Cuba |
| Minimum | 16.7% | 6.3% |
| Maximum | 100.0% | 93.3% |
| Range | 83.3% | 87.0% |
| Mean | 46.4% | 43.0% |
| Median | 38.0% | 41.2% |
| Interquartile 25% (IQ1) | 28.3% | 32.8% |
| Interquartile 75% (IQ3) | 60.0% | 53.1% |
| Interquartile Range (IQR) | 31.7% | 20.3% |
| Standard Deviation (Sample) | 24.5% | 15.9% |
| Standard Deviation (Population) | 24.3% | 15.8% |
Similar Demographics by Births to Unmarried Women
Demographics Similar to Europeans by Births to Unmarried Women
In terms of births to unmarried women, the demographic groups most similar to Europeans are Chinese (30.2%, a difference of 0.030%), Vietnamese (30.2%, a difference of 0.12%), Croatian (30.2%, a difference of 0.19%), Syrian (30.2%, a difference of 0.23%), and Icelander (30.3%, a difference of 0.27%).
| Demographics | Rating | Rank | Births to Unmarried Women |
| Argentineans | 90.5 /100 | #119 | Exceptional 30.0% |
| Ugandans | 89.2 /100 | #120 | Excellent 30.1% |
| Koreans | 88.9 /100 | #121 | Excellent 30.1% |
| Immigrants | Argentina | 88.7 /100 | #122 | Excellent 30.1% |
| Syrians | 88.2 /100 | #123 | Excellent 30.2% |
| Croatians | 88.0 /100 | #124 | Excellent 30.2% |
| Vietnamese | 87.7 /100 | #125 | Excellent 30.2% |
| Europeans | 87.2 /100 | #126 | Excellent 30.2% |
| Chinese | 87.1 /100 | #127 | Excellent 30.2% |
| Icelanders | 86.0 /100 | #128 | Excellent 30.3% |
| Immigrants | Spain | 85.8 /100 | #129 | Excellent 30.3% |
| Immigrants | Bosnia and Herzegovina | 85.7 /100 | #130 | Excellent 30.3% |
| Immigrants | Zimbabwe | 85.7 /100 | #131 | Excellent 30.3% |
| New Zealanders | 85.5 /100 | #132 | Excellent 30.3% |
| Immigrants | Morocco | 85.2 /100 | #133 | Excellent 30.4% |
Demographics Similar to Immigrants from Cuba by Births to Unmarried Women
In terms of births to unmarried women, the demographic groups most similar to Immigrants from Cuba are Cheyenne (41.3%, a difference of 0.27%), Cape Verdean (41.3%, a difference of 0.33%), Sioux (41.0%, a difference of 1.1%), Cajun (41.0%, a difference of 1.2%), and Tsimshian (42.2%, a difference of 1.7%).
| Demographics | Rating | Rank | Births to Unmarried Women |
| Yakama | 0.0 /100 | #319 | Tragic 40.3% |
| Crow | 0.0 /100 | #320 | Tragic 40.4% |
| Bahamians | 0.0 /100 | #321 | Tragic 40.8% |
| Cajuns | 0.0 /100 | #322 | Tragic 41.0% |
| Sioux | 0.0 /100 | #323 | Tragic 41.0% |
| Cape Verdeans | 0.0 /100 | #324 | Tragic 41.3% |
| Cheyenne | 0.0 /100 | #325 | Tragic 41.3% |
| Immigrants | Cuba | 0.0 /100 | #326 | Tragic 41.5% |
| Tsimshian | 0.0 /100 | #327 | Tragic 42.2% |
| Immigrants | Cabo Verde | 0.0 /100 | #328 | Tragic 42.2% |
| Paiute | 0.0 /100 | #329 | Tragic 42.5% |
| Chippewa | 0.0 /100 | #330 | Tragic 42.6% |
| Natives/Alaskans | 0.0 /100 | #331 | Tragic 43.0% |
| Kiowa | 0.0 /100 | #332 | Tragic 43.1% |
| Blacks/African Americans | 0.0 /100 | #333 | Tragic 44.3% |