Ethiopian vs Immigrants from Czechoslovakia Married-couple Households
COMPARE
Ethiopian
Immigrants from Czechoslovakia
Married-couple Households
Married-couple Households Comparison
Ethiopians
Immigrants from Czechoslovakia
43.2%
MARRIED-COUPLE HOUSEHOLDS
0.1/ 100
METRIC RATING
273rd/ 347
METRIC RANK
47.8%
MARRIED-COUPLE HOUSEHOLDS
95.5/ 100
METRIC RATING
105th/ 347
METRIC RANK
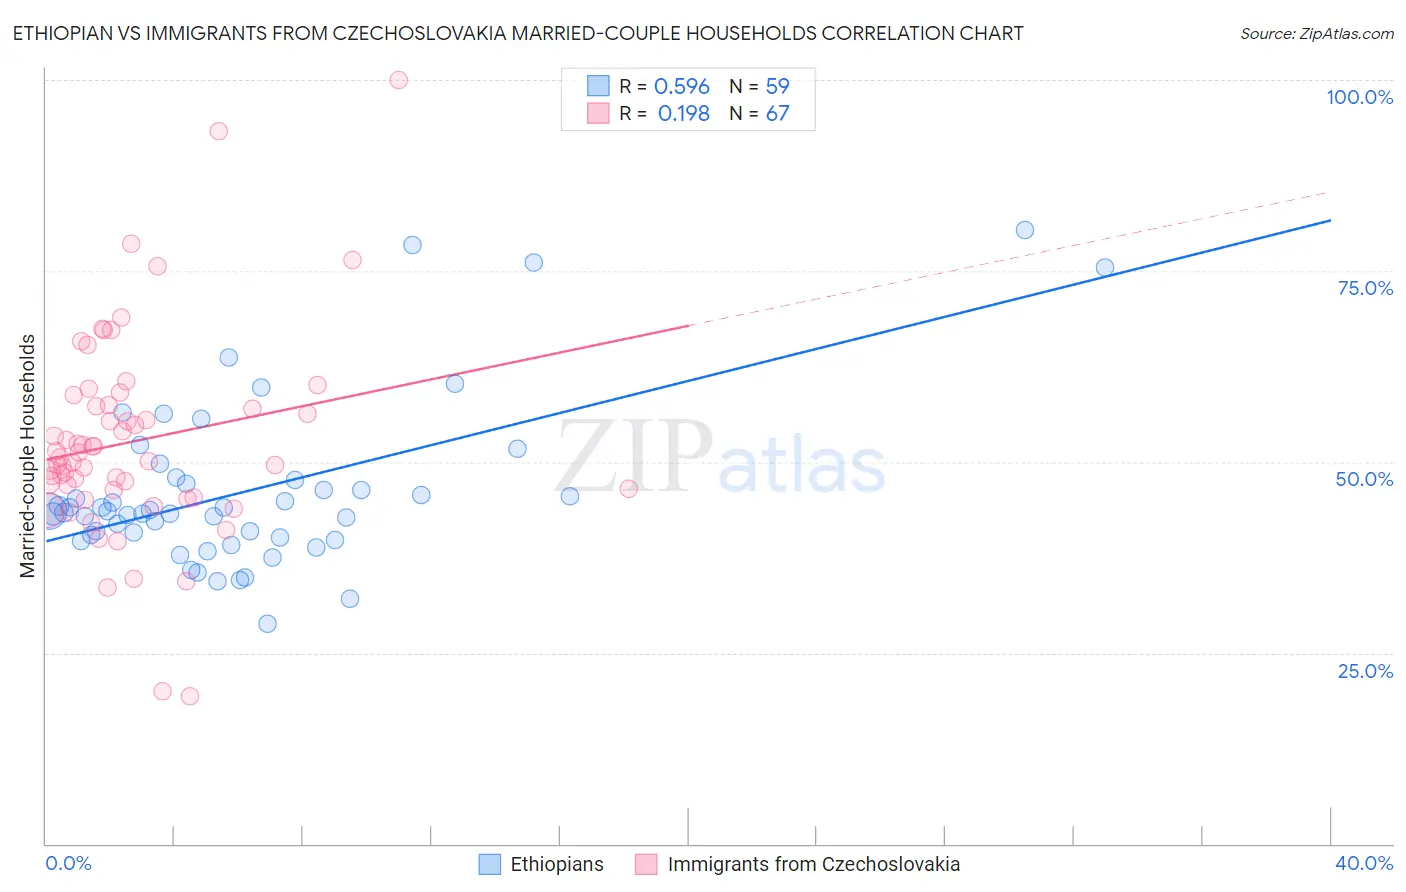
Ethiopian vs Immigrants from Czechoslovakia Married-couple Households Correlation Chart
The statistical analysis conducted on geographies consisting of 223,091,132 people shows a substantial positive correlation between the proportion of Ethiopians and percentage of married-couple family households in the United States with a correlation coefficient (R) of 0.596 and weighted average of 43.2%. Similarly, the statistical analysis conducted on geographies consisting of 195,446,712 people shows a poor positive correlation between the proportion of Immigrants from Czechoslovakia and percentage of married-couple family households in the United States with a correlation coefficient (R) of 0.198 and weighted average of 47.8%, a difference of 10.7%.
Married-couple Households Correlation Summary
| Measurement | Ethiopian | Immigrants from Czechoslovakia |
| Minimum | 28.9% | 19.3% |
| Maximum | 80.4% | 100.0% |
| Range | 51.5% | 80.7% |
| Mean | 46.2% | 52.7% |
| Median | 43.6% | 50.6% |
| Interquartile 25% (IQ1) | 40.1% | 46.3% |
| Interquartile 75% (IQ3) | 47.7% | 57.4% |
| Interquartile Range (IQR) | 7.6% | 11.1% |
| Standard Deviation (Sample) | 10.9% | 13.4% |
| Standard Deviation (Population) | 10.8% | 13.3% |
Similar Demographics by Married-couple Households
Demographics Similar to Ethiopians by Married-couple Households
In terms of married-couple households, the demographic groups most similar to Ethiopians are Nigerian (43.2%, a difference of 0.010%), Immigrants from Nigeria (43.2%, a difference of 0.10%), Immigrants from Bangladesh (43.1%, a difference of 0.15%), Guatemalan (43.3%, a difference of 0.20%), and Immigrants from Ethiopia (43.1%, a difference of 0.26%).
| Demographics | Rating | Rank | Married-couple Households |
| Ecuadorians | 0.1 /100 | #266 | Tragic 43.5% |
| Natives/Alaskans | 0.1 /100 | #267 | Tragic 43.5% |
| Immigrants | Burma/Myanmar | 0.1 /100 | #268 | Tragic 43.4% |
| Immigrants | Sierra Leone | 0.1 /100 | #269 | Tragic 43.3% |
| Yuman | 0.1 /100 | #270 | Tragic 43.3% |
| Guatemalans | 0.1 /100 | #271 | Tragic 43.3% |
| Immigrants | Nigeria | 0.1 /100 | #272 | Tragic 43.2% |
| Ethiopians | 0.1 /100 | #273 | Tragic 43.2% |
| Nigerians | 0.1 /100 | #274 | Tragic 43.2% |
| Immigrants | Bangladesh | 0.0 /100 | #275 | Tragic 43.1% |
| Immigrants | Ethiopia | 0.0 /100 | #276 | Tragic 43.1% |
| Immigrants | Eastern Africa | 0.0 /100 | #277 | Tragic 42.9% |
| Immigrants | Africa | 0.0 /100 | #278 | Tragic 42.9% |
| Sierra Leoneans | 0.0 /100 | #279 | Tragic 42.9% |
| Immigrants | Ecuador | 0.0 /100 | #280 | Tragic 42.9% |
Demographics Similar to Immigrants from Czechoslovakia by Married-couple Households
In terms of married-couple households, the demographic groups most similar to Immigrants from Czechoslovakia are Portuguese (47.8%, a difference of 0.010%), Immigrants from South Africa (47.8%, a difference of 0.10%), Slavic (47.8%, a difference of 0.11%), Hawaiian (47.8%, a difference of 0.11%), and Turkish (47.8%, a difference of 0.13%).
| Demographics | Rating | Rank | Married-couple Households |
| Immigrants | North Macedonia | 96.4 /100 | #98 | Exceptional 47.9% |
| Immigrants | Austria | 96.4 /100 | #99 | Exceptional 47.9% |
| Immigrants | Italy | 96.3 /100 | #100 | Exceptional 47.9% |
| Turks | 96.1 /100 | #101 | Exceptional 47.8% |
| Slavs | 96.0 /100 | #102 | Exceptional 47.8% |
| Hawaiians | 96.0 /100 | #103 | Exceptional 47.8% |
| Immigrants | South Africa | 96.0 /100 | #104 | Exceptional 47.8% |
| Immigrants | Czechoslovakia | 95.5 /100 | #105 | Exceptional 47.8% |
| Portuguese | 95.5 /100 | #106 | Exceptional 47.8% |
| Estonians | 94.7 /100 | #107 | Exceptional 47.7% |
| Immigrants | Japan | 94.4 /100 | #108 | Exceptional 47.7% |
| Immigrants | Jordan | 94.1 /100 | #109 | Exceptional 47.7% |
| Macedonians | 93.9 /100 | #110 | Exceptional 47.6% |
| Syrians | 93.9 /100 | #111 | Exceptional 47.6% |
| Peruvians | 93.8 /100 | #112 | Exceptional 47.6% |