Ethiopian vs Immigrants Married-couple Households
COMPARE
Ethiopian
Immigrants
Married-couple Households
Married-couple Households Comparison
Ethiopians
Immigrants
43.2%
MARRIED-COUPLE HOUSEHOLDS
0.1/ 100
METRIC RATING
273rd/ 347
METRIC RANK
46.3%
MARRIED-COUPLE HOUSEHOLDS
43.8/ 100
METRIC RATING
177th/ 347
METRIC RANK
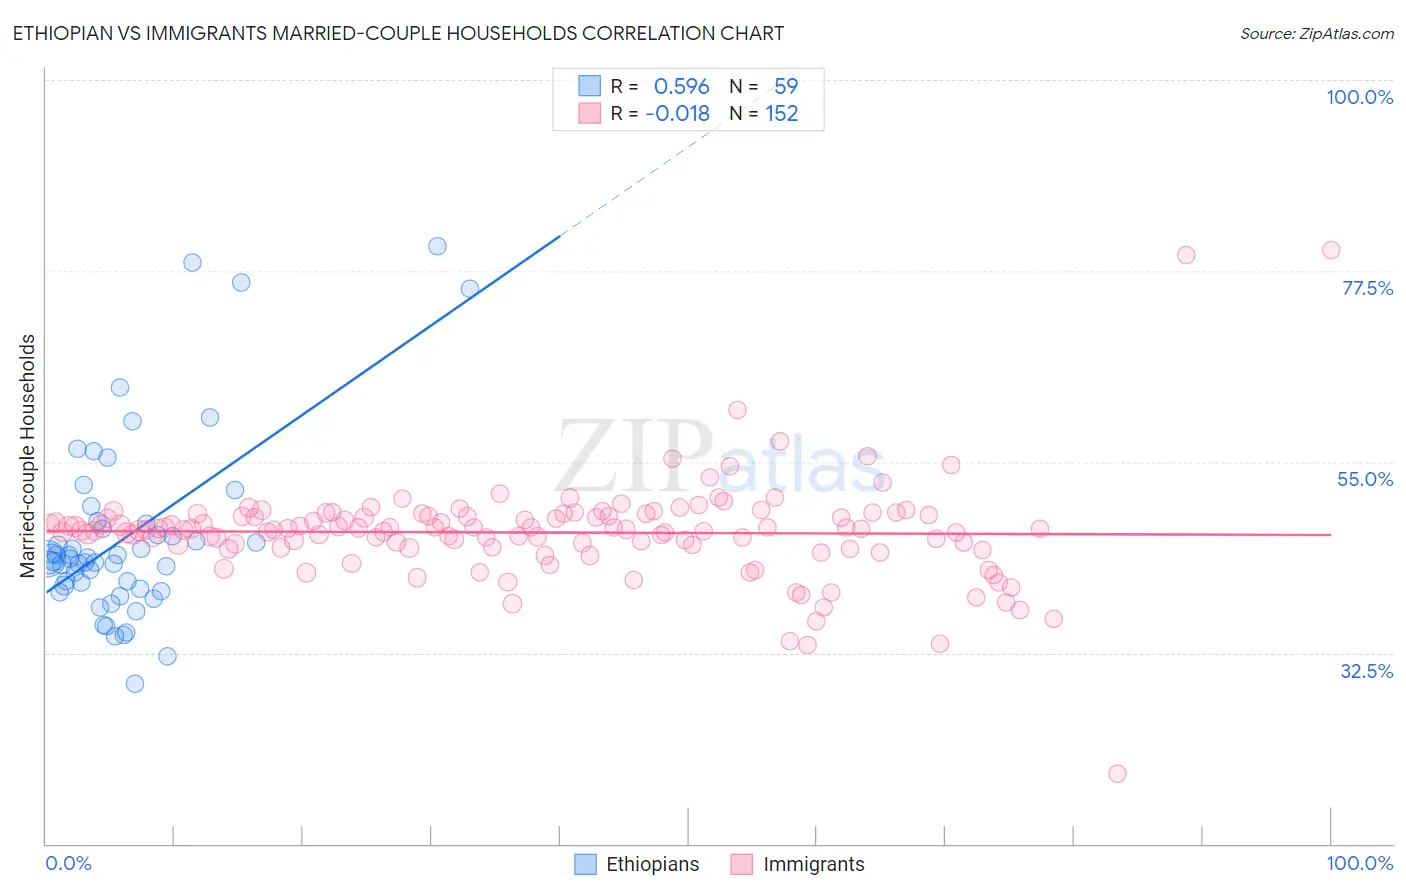
Ethiopian vs Immigrants Married-couple Households Correlation Chart
The statistical analysis conducted on geographies consisting of 223,091,132 people shows a substantial positive correlation between the proportion of Ethiopians and percentage of married-couple family households in the United States with a correlation coefficient (R) of 0.596 and weighted average of 43.2%. Similarly, the statistical analysis conducted on geographies consisting of 577,047,094 people shows no correlation between the proportion of Immigrants and percentage of married-couple family households in the United States with a correlation coefficient (R) of -0.018 and weighted average of 46.3%, a difference of 7.3%.
Married-couple Households Correlation Summary
| Measurement | Ethiopian | Immigrants |
| Minimum | 28.9% | 18.2% |
| Maximum | 80.4% | 80.0% |
| Range | 51.5% | 61.8% |
| Mean | 46.2% | 46.7% |
| Median | 43.6% | 47.1% |
| Interquartile 25% (IQ1) | 40.1% | 45.1% |
| Interquartile 75% (IQ3) | 47.7% | 48.7% |
| Interquartile Range (IQR) | 7.6% | 3.7% |
| Standard Deviation (Sample) | 10.9% | 6.1% |
| Standard Deviation (Population) | 10.8% | 6.1% |
Similar Demographics by Married-couple Households
Demographics Similar to Ethiopians by Married-couple Households
In terms of married-couple households, the demographic groups most similar to Ethiopians are Nigerian (43.2%, a difference of 0.010%), Immigrants from Nigeria (43.2%, a difference of 0.10%), Immigrants from Bangladesh (43.1%, a difference of 0.15%), Guatemalan (43.3%, a difference of 0.20%), and Immigrants from Ethiopia (43.1%, a difference of 0.26%).
| Demographics | Rating | Rank | Married-couple Households |
| Ecuadorians | 0.1 /100 | #266 | Tragic 43.5% |
| Natives/Alaskans | 0.1 /100 | #267 | Tragic 43.5% |
| Immigrants | Burma/Myanmar | 0.1 /100 | #268 | Tragic 43.4% |
| Immigrants | Sierra Leone | 0.1 /100 | #269 | Tragic 43.3% |
| Yuman | 0.1 /100 | #270 | Tragic 43.3% |
| Guatemalans | 0.1 /100 | #271 | Tragic 43.3% |
| Immigrants | Nigeria | 0.1 /100 | #272 | Tragic 43.2% |
| Ethiopians | 0.1 /100 | #273 | Tragic 43.2% |
| Nigerians | 0.1 /100 | #274 | Tragic 43.2% |
| Immigrants | Bangladesh | 0.0 /100 | #275 | Tragic 43.1% |
| Immigrants | Ethiopia | 0.0 /100 | #276 | Tragic 43.1% |
| Immigrants | Eastern Africa | 0.0 /100 | #277 | Tragic 42.9% |
| Immigrants | Africa | 0.0 /100 | #278 | Tragic 42.9% |
| Sierra Leoneans | 0.0 /100 | #279 | Tragic 42.9% |
| Immigrants | Ecuador | 0.0 /100 | #280 | Tragic 42.9% |
Demographics Similar to Immigrants by Married-couple Households
In terms of married-couple households, the demographic groups most similar to Immigrants are Immigrants from Costa Rica (46.3%, a difference of 0.020%), Immigrants from Zimbabwe (46.3%, a difference of 0.030%), Cajun (46.4%, a difference of 0.060%), Mongolian (46.3%, a difference of 0.070%), and Malaysian (46.3%, a difference of 0.080%).
| Demographics | Rating | Rank | Married-couple Households |
| South Americans | 58.0 /100 | #170 | Average 46.6% |
| Immigrants | Chile | 55.7 /100 | #171 | Average 46.5% |
| Immigrants | Australia | 54.6 /100 | #172 | Average 46.5% |
| Immigrants | Norway | 52.0 /100 | #173 | Average 46.5% |
| Immigrants | Mexico | 50.0 /100 | #174 | Average 46.4% |
| Immigrants | Colombia | 46.1 /100 | #175 | Average 46.4% |
| Cajuns | 45.2 /100 | #176 | Average 46.4% |
| Immigrants | Immigrants | 43.8 /100 | #177 | Average 46.3% |
| Immigrants | Costa Rica | 43.4 /100 | #178 | Average 46.3% |
| Immigrants | Zimbabwe | 43.0 /100 | #179 | Average 46.3% |
| Mongolians | 42.0 /100 | #180 | Average 46.3% |
| Malaysians | 41.8 /100 | #181 | Average 46.3% |
| Yugoslavians | 38.9 /100 | #182 | Fair 46.2% |
| Immigrants | Brazil | 38.3 /100 | #183 | Fair 46.2% |
| Immigrants | Switzerland | 36.9 /100 | #184 | Fair 46.2% |