Ethiopian vs Immigrants from Australia Married-couple Households
COMPARE
Ethiopian
Immigrants from Australia
Married-couple Households
Married-couple Households Comparison
Ethiopians
Immigrants from Australia
43.2%
MARRIED-COUPLE HOUSEHOLDS
0.1/ 100
METRIC RATING
273rd/ 347
METRIC RANK
46.5%
MARRIED-COUPLE HOUSEHOLDS
54.6/ 100
METRIC RATING
172nd/ 347
METRIC RANK
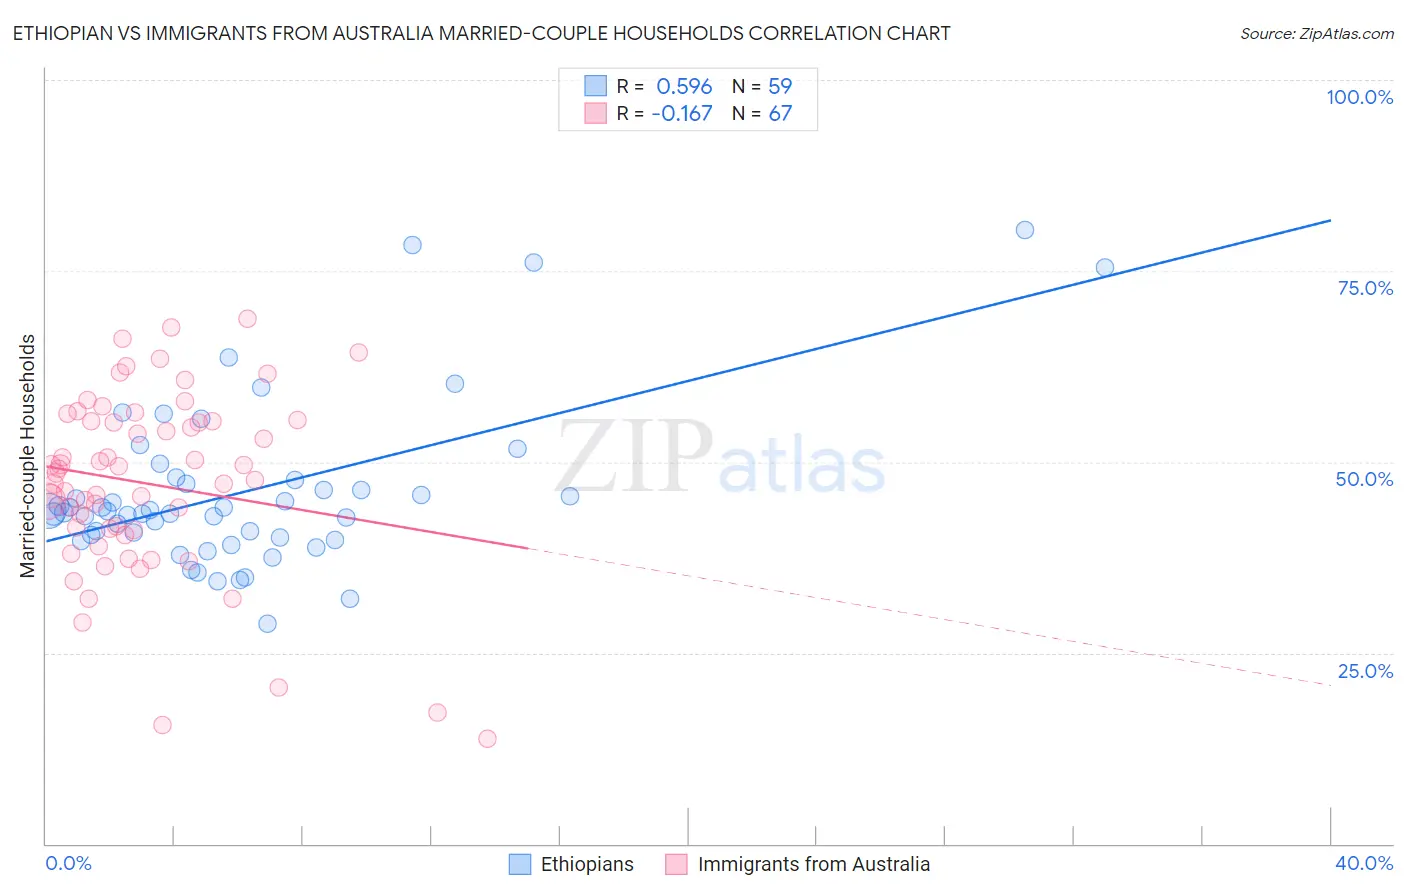
Ethiopian vs Immigrants from Australia Married-couple Households Correlation Chart
The statistical analysis conducted on geographies consisting of 223,091,132 people shows a substantial positive correlation between the proportion of Ethiopians and percentage of married-couple family households in the United States with a correlation coefficient (R) of 0.596 and weighted average of 43.2%. Similarly, the statistical analysis conducted on geographies consisting of 227,144,828 people shows a poor negative correlation between the proportion of Immigrants from Australia and percentage of married-couple family households in the United States with a correlation coefficient (R) of -0.167 and weighted average of 46.5%, a difference of 7.8%.
Married-couple Households Correlation Summary
| Measurement | Ethiopian | Immigrants from Australia |
| Minimum | 28.9% | 13.7% |
| Maximum | 80.4% | 68.8% |
| Range | 51.5% | 55.0% |
| Mean | 46.2% | 47.2% |
| Median | 43.6% | 48.5% |
| Interquartile 25% (IQ1) | 40.1% | 41.1% |
| Interquartile 75% (IQ3) | 47.7% | 55.3% |
| Interquartile Range (IQR) | 7.6% | 14.1% |
| Standard Deviation (Sample) | 10.9% | 12.0% |
| Standard Deviation (Population) | 10.8% | 11.9% |
Similar Demographics by Married-couple Households
Demographics Similar to Ethiopians by Married-couple Households
In terms of married-couple households, the demographic groups most similar to Ethiopians are Nigerian (43.2%, a difference of 0.010%), Immigrants from Nigeria (43.2%, a difference of 0.10%), Immigrants from Bangladesh (43.1%, a difference of 0.15%), Guatemalan (43.3%, a difference of 0.20%), and Immigrants from Ethiopia (43.1%, a difference of 0.26%).
| Demographics | Rating | Rank | Married-couple Households |
| Ecuadorians | 0.1 /100 | #266 | Tragic 43.5% |
| Natives/Alaskans | 0.1 /100 | #267 | Tragic 43.5% |
| Immigrants | Burma/Myanmar | 0.1 /100 | #268 | Tragic 43.4% |
| Immigrants | Sierra Leone | 0.1 /100 | #269 | Tragic 43.3% |
| Yuman | 0.1 /100 | #270 | Tragic 43.3% |
| Guatemalans | 0.1 /100 | #271 | Tragic 43.3% |
| Immigrants | Nigeria | 0.1 /100 | #272 | Tragic 43.2% |
| Ethiopians | 0.1 /100 | #273 | Tragic 43.2% |
| Nigerians | 0.1 /100 | #274 | Tragic 43.2% |
| Immigrants | Bangladesh | 0.0 /100 | #275 | Tragic 43.1% |
| Immigrants | Ethiopia | 0.0 /100 | #276 | Tragic 43.1% |
| Immigrants | Eastern Africa | 0.0 /100 | #277 | Tragic 42.9% |
| Immigrants | Africa | 0.0 /100 | #278 | Tragic 42.9% |
| Sierra Leoneans | 0.0 /100 | #279 | Tragic 42.9% |
| Immigrants | Ecuador | 0.0 /100 | #280 | Tragic 42.9% |
Demographics Similar to Immigrants from Australia by Married-couple Households
In terms of married-couple households, the demographic groups most similar to Immigrants from Australia are Immigrants from Chile (46.5%, a difference of 0.040%), Immigrants from Norway (46.5%, a difference of 0.10%), South American (46.6%, a difference of 0.13%), Immigrants from Mexico (46.4%, a difference of 0.17%), and Spanish American Indian (46.6%, a difference of 0.18%).
| Demographics | Rating | Rank | Married-couple Households |
| Immigrants | Southern Europe | 69.9 /100 | #165 | Good 46.8% |
| Cherokee | 65.7 /100 | #166 | Good 46.7% |
| Immigrants | Croatia | 64.2 /100 | #167 | Good 46.7% |
| Israelis | 62.3 /100 | #168 | Good 46.7% |
| Spanish American Indians | 59.4 /100 | #169 | Average 46.6% |
| South Americans | 58.0 /100 | #170 | Average 46.6% |
| Immigrants | Chile | 55.7 /100 | #171 | Average 46.5% |
| Immigrants | Australia | 54.6 /100 | #172 | Average 46.5% |
| Immigrants | Norway | 52.0 /100 | #173 | Average 46.5% |
| Immigrants | Mexico | 50.0 /100 | #174 | Average 46.4% |
| Immigrants | Colombia | 46.1 /100 | #175 | Average 46.4% |
| Cajuns | 45.2 /100 | #176 | Average 46.4% |
| Immigrants | Immigrants | 43.8 /100 | #177 | Average 46.3% |
| Immigrants | Costa Rica | 43.4 /100 | #178 | Average 46.3% |
| Immigrants | Zimbabwe | 43.0 /100 | #179 | Average 46.3% |