Ethiopian vs Immigrants from Hong Kong Married-couple Households
COMPARE
Ethiopian
Immigrants from Hong Kong
Married-couple Households
Married-couple Households Comparison
Ethiopians
Immigrants from Hong Kong
43.2%
MARRIED-COUPLE HOUSEHOLDS
0.1/ 100
METRIC RATING
273rd/ 347
METRIC RANK
49.6%
MARRIED-COUPLE HOUSEHOLDS
99.9/ 100
METRIC RATING
17th/ 347
METRIC RANK
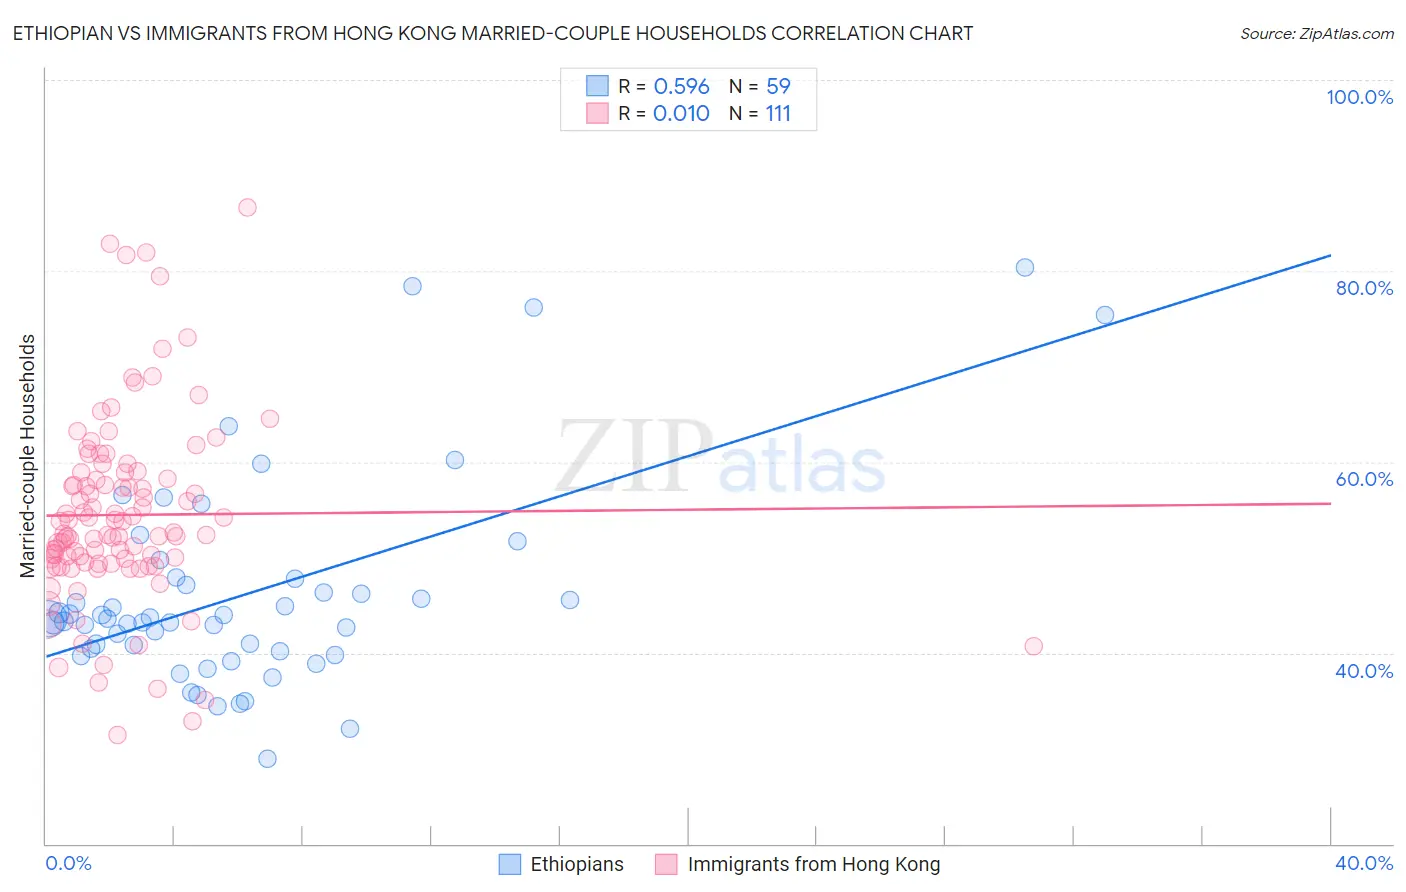
Ethiopian vs Immigrants from Hong Kong Married-couple Households Correlation Chart
The statistical analysis conducted on geographies consisting of 223,091,132 people shows a substantial positive correlation between the proportion of Ethiopians and percentage of married-couple family households in the United States with a correlation coefficient (R) of 0.596 and weighted average of 43.2%. Similarly, the statistical analysis conducted on geographies consisting of 253,895,593 people shows no correlation between the proportion of Immigrants from Hong Kong and percentage of married-couple family households in the United States with a correlation coefficient (R) of 0.010 and weighted average of 49.6%, a difference of 15.0%.
Married-couple Households Correlation Summary
| Measurement | Ethiopian | Immigrants from Hong Kong |
| Minimum | 28.9% | 31.4% |
| Maximum | 80.4% | 86.6% |
| Range | 51.5% | 55.2% |
| Mean | 46.2% | 54.4% |
| Median | 43.6% | 52.5% |
| Interquartile 25% (IQ1) | 40.1% | 49.3% |
| Interquartile 75% (IQ3) | 47.7% | 58.8% |
| Interquartile Range (IQR) | 7.6% | 9.5% |
| Standard Deviation (Sample) | 10.9% | 9.9% |
| Standard Deviation (Population) | 10.8% | 9.9% |
Similar Demographics by Married-couple Households
Demographics Similar to Ethiopians by Married-couple Households
In terms of married-couple households, the demographic groups most similar to Ethiopians are Nigerian (43.2%, a difference of 0.010%), Immigrants from Nigeria (43.2%, a difference of 0.10%), Immigrants from Bangladesh (43.1%, a difference of 0.15%), Guatemalan (43.3%, a difference of 0.20%), and Immigrants from Ethiopia (43.1%, a difference of 0.26%).
| Demographics | Rating | Rank | Married-couple Households |
| Ecuadorians | 0.1 /100 | #266 | Tragic 43.5% |
| Natives/Alaskans | 0.1 /100 | #267 | Tragic 43.5% |
| Immigrants | Burma/Myanmar | 0.1 /100 | #268 | Tragic 43.4% |
| Immigrants | Sierra Leone | 0.1 /100 | #269 | Tragic 43.3% |
| Yuman | 0.1 /100 | #270 | Tragic 43.3% |
| Guatemalans | 0.1 /100 | #271 | Tragic 43.3% |
| Immigrants | Nigeria | 0.1 /100 | #272 | Tragic 43.2% |
| Ethiopians | 0.1 /100 | #273 | Tragic 43.2% |
| Nigerians | 0.1 /100 | #274 | Tragic 43.2% |
| Immigrants | Bangladesh | 0.0 /100 | #275 | Tragic 43.1% |
| Immigrants | Ethiopia | 0.0 /100 | #276 | Tragic 43.1% |
| Immigrants | Eastern Africa | 0.0 /100 | #277 | Tragic 42.9% |
| Immigrants | Africa | 0.0 /100 | #278 | Tragic 42.9% |
| Sierra Leoneans | 0.0 /100 | #279 | Tragic 42.9% |
| Immigrants | Ecuador | 0.0 /100 | #280 | Tragic 42.9% |
Demographics Similar to Immigrants from Hong Kong by Married-couple Households
In terms of married-couple households, the demographic groups most similar to Immigrants from Hong Kong are English (49.6%, a difference of 0.010%), Swedish (49.7%, a difference of 0.15%), European (49.6%, a difference of 0.17%), Scandinavian (49.6%, a difference of 0.17%), and Korean (49.7%, a difference of 0.18%).
| Demographics | Rating | Rank | Married-couple Households |
| Chinese | 100.0 /100 | #10 | Exceptional 50.4% |
| Immigrants | Pakistan | 100.0 /100 | #11 | Exceptional 50.1% |
| Swiss | 100.0 /100 | #12 | Exceptional 49.9% |
| Immigrants | Korea | 100.0 /100 | #13 | Exceptional 49.9% |
| Burmese | 100.0 /100 | #14 | Exceptional 49.8% |
| Koreans | 99.9 /100 | #15 | Exceptional 49.7% |
| Swedes | 99.9 /100 | #16 | Exceptional 49.7% |
| Immigrants | Hong Kong | 99.9 /100 | #17 | Exceptional 49.6% |
| English | 99.9 /100 | #18 | Exceptional 49.6% |
| Europeans | 99.9 /100 | #19 | Exceptional 49.6% |
| Scandinavians | 99.9 /100 | #20 | Exceptional 49.6% |
| Norwegians | 99.9 /100 | #21 | Exceptional 49.5% |
| Asians | 99.9 /100 | #22 | Exceptional 49.5% |
| Dutch | 99.9 /100 | #23 | Exceptional 49.5% |
| Czechs | 99.9 /100 | #24 | Exceptional 49.4% |