Ethiopian vs Immigrants from Latvia Female Disability
COMPARE
Ethiopian
Immigrants from Latvia
Female Disability
Female Disability Comparison
Ethiopians
Immigrants from Latvia
11.2%
FEMALE DISABILITY
100.0/ 100
METRIC RATING
37th/ 347
METRIC RANK
11.8%
FEMALE DISABILITY
95.6/ 100
METRIC RATING
128th/ 347
METRIC RANK
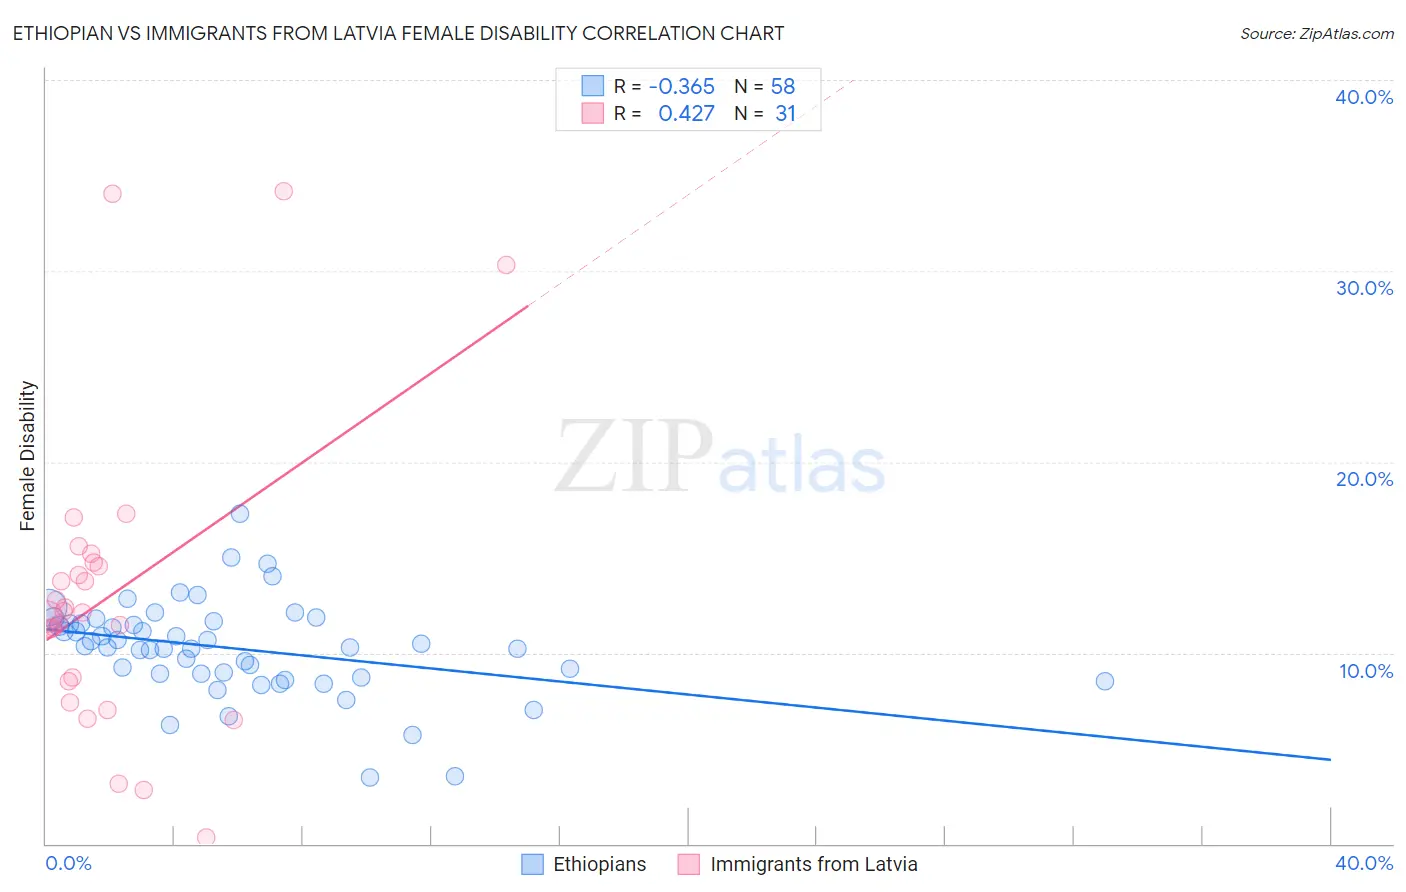
Ethiopian vs Immigrants from Latvia Female Disability Correlation Chart
The statistical analysis conducted on geographies consisting of 223,237,211 people shows a mild negative correlation between the proportion of Ethiopians and percentage of females with a disability in the United States with a correlation coefficient (R) of -0.365 and weighted average of 11.2%. Similarly, the statistical analysis conducted on geographies consisting of 113,739,259 people shows a moderate positive correlation between the proportion of Immigrants from Latvia and percentage of females with a disability in the United States with a correlation coefficient (R) of 0.427 and weighted average of 11.8%, a difference of 5.8%.
Female Disability Correlation Summary
| Measurement | Ethiopian | Immigrants from Latvia |
| Minimum | 3.5% | 0.34% |
| Maximum | 17.3% | 34.2% |
| Range | 13.8% | 33.8% |
| Mean | 10.2% | 13.0% |
| Median | 10.3% | 12.1% |
| Interquartile 25% (IQ1) | 8.9% | 8.5% |
| Interquartile 75% (IQ3) | 11.5% | 14.7% |
| Interquartile Range (IQR) | 2.7% | 6.2% |
| Standard Deviation (Sample) | 2.5% | 7.8% |
| Standard Deviation (Population) | 2.5% | 7.6% |
Similar Demographics by Female Disability
Demographics Similar to Ethiopians by Female Disability
In terms of female disability, the demographic groups most similar to Ethiopians are Cypriot (11.2%, a difference of 0.010%), Immigrants from Ethiopia (11.2%, a difference of 0.030%), Immigrants from Japan (11.2%, a difference of 0.080%), Immigrants from Indonesia (11.2%, a difference of 0.22%), and Immigrants from Lithuania (11.2%, a difference of 0.24%).
| Demographics | Rating | Rank | Female Disability |
| Turks | 100.0 /100 | #30 | Exceptional 11.1% |
| Immigrants | Kuwait | 100.0 /100 | #31 | Exceptional 11.1% |
| Immigrants | Australia | 100.0 /100 | #32 | Exceptional 11.1% |
| Immigrants | Egypt | 100.0 /100 | #33 | Exceptional 11.1% |
| Immigrants | Indonesia | 100.0 /100 | #34 | Exceptional 11.2% |
| Immigrants | Japan | 100.0 /100 | #35 | Exceptional 11.2% |
| Cypriots | 100.0 /100 | #36 | Exceptional 11.2% |
| Ethiopians | 100.0 /100 | #37 | Exceptional 11.2% |
| Immigrants | Ethiopia | 100.0 /100 | #38 | Exceptional 11.2% |
| Immigrants | Lithuania | 100.0 /100 | #39 | Exceptional 11.2% |
| Mongolians | 100.0 /100 | #40 | Exceptional 11.2% |
| Paraguayans | 100.0 /100 | #41 | Exceptional 11.2% |
| Israelis | 100.0 /100 | #42 | Exceptional 11.2% |
| Afghans | 100.0 /100 | #43 | Exceptional 11.2% |
| Cambodians | 100.0 /100 | #44 | Exceptional 11.3% |
Demographics Similar to Immigrants from Latvia by Female Disability
In terms of female disability, the demographic groups most similar to Immigrants from Latvia are Macedonian (11.8%, a difference of 0.030%), South American Indian (11.8%, a difference of 0.040%), Nicaraguan (11.9%, a difference of 0.090%), Arab (11.9%, a difference of 0.12%), and Immigrants from Europe (11.8%, a difference of 0.14%).
| Demographics | Rating | Rank | Female Disability |
| Immigrants | Netherlands | 96.9 /100 | #121 | Exceptional 11.8% |
| Immigrants | North Macedonia | 96.8 /100 | #122 | Exceptional 11.8% |
| Immigrants | Croatia | 96.7 /100 | #123 | Exceptional 11.8% |
| Russians | 96.5 /100 | #124 | Exceptional 11.8% |
| Immigrants | Italy | 96.4 /100 | #125 | Exceptional 11.8% |
| Immigrants | Europe | 96.2 /100 | #126 | Exceptional 11.8% |
| South American Indians | 95.8 /100 | #127 | Exceptional 11.8% |
| Immigrants | Latvia | 95.6 /100 | #128 | Exceptional 11.8% |
| Macedonians | 95.5 /100 | #129 | Exceptional 11.8% |
| Nicaraguans | 95.2 /100 | #130 | Exceptional 11.9% |
| Arabs | 95.1 /100 | #131 | Exceptional 11.9% |
| Immigrants | Syria | 94.6 /100 | #132 | Exceptional 11.9% |
| Kenyans | 94.5 /100 | #133 | Exceptional 11.9% |
| Immigrants | Nicaragua | 94.5 /100 | #134 | Exceptional 11.9% |
| Central Americans | 94.2 /100 | #135 | Exceptional 11.9% |