Ethiopian vs Immigrants from Germany Currently Married
COMPARE
Ethiopian
Immigrants from Germany
Currently Married
Currently Married Comparison
Ethiopians
Immigrants from Germany
44.5%
CURRENTLY MARRIED
0.7/ 100
METRIC RATING
241st/ 347
METRIC RANK
47.8%
CURRENTLY MARRIED
94.1/ 100
METRIC RATING
101st/ 347
METRIC RANK
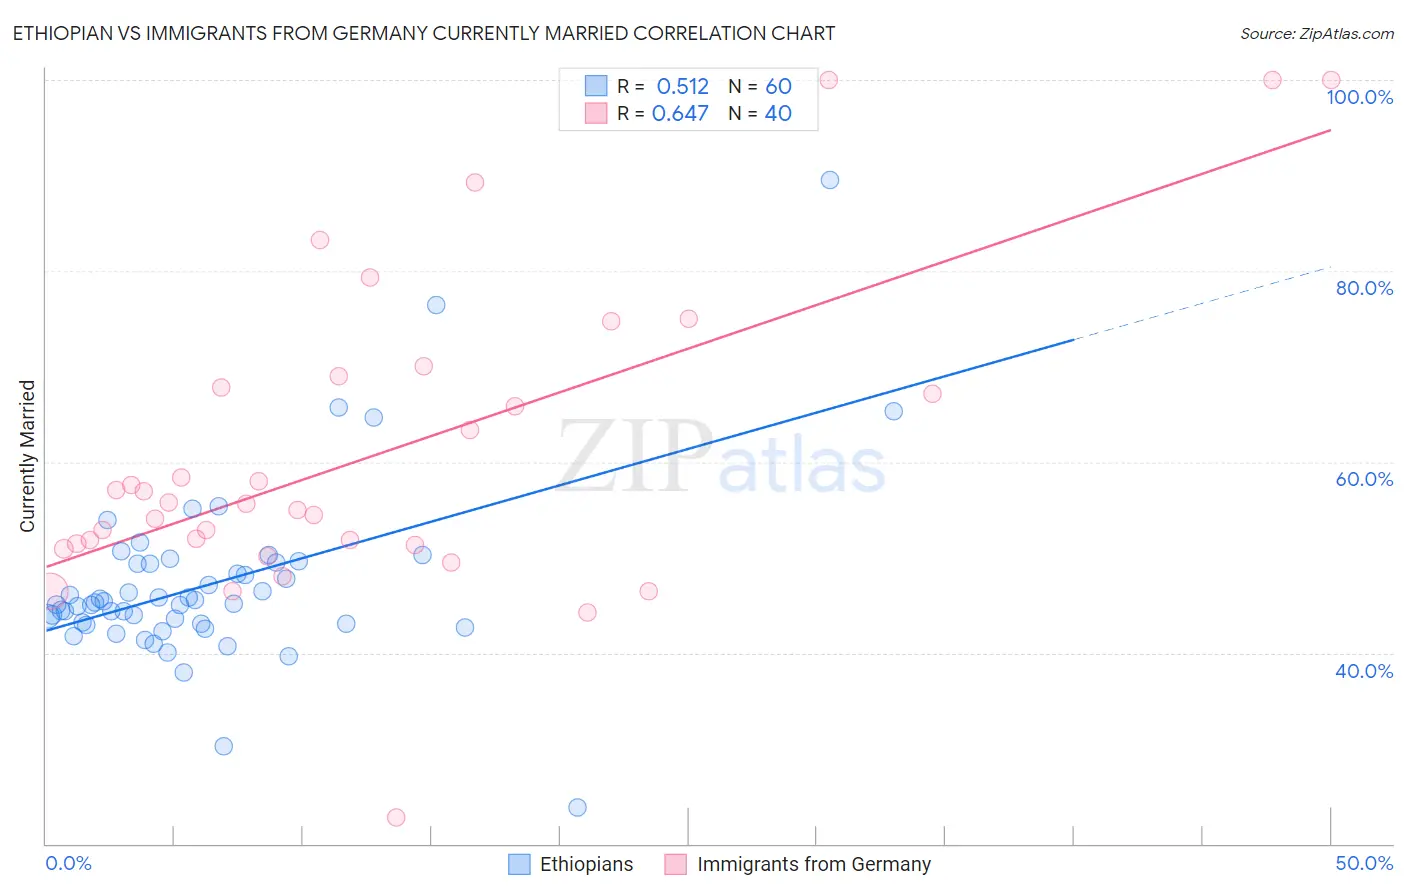
Ethiopian vs Immigrants from Germany Currently Married Correlation Chart
The statistical analysis conducted on geographies consisting of 223,255,094 people shows a substantial positive correlation between the proportion of Ethiopians and percentage of population currently married in the United States with a correlation coefficient (R) of 0.512 and weighted average of 44.5%. Similarly, the statistical analysis conducted on geographies consisting of 463,859,108 people shows a significant positive correlation between the proportion of Immigrants from Germany and percentage of population currently married in the United States with a correlation coefficient (R) of 0.647 and weighted average of 47.8%, a difference of 7.4%.
Currently Married Correlation Summary
| Measurement | Ethiopian | Immigrants from Germany |
| Minimum | 23.8% | 22.7% |
| Maximum | 89.5% | 100.0% |
| Range | 65.7% | 77.3% |
| Mean | 47.3% | 60.9% |
| Median | 45.2% | 55.7% |
| Interquartile 25% (IQ1) | 43.0% | 51.4% |
| Interquartile 75% (IQ3) | 49.4% | 68.4% |
| Interquartile Range (IQR) | 6.3% | 17.0% |
| Standard Deviation (Sample) | 9.5% | 16.5% |
| Standard Deviation (Population) | 9.4% | 16.3% |
Similar Demographics by Currently Married
Demographics Similar to Ethiopians by Currently Married
In terms of currently married, the demographic groups most similar to Ethiopians are Immigrants from Cambodia (44.5%, a difference of 0.030%), Immigrants from Ethiopia (44.5%, a difference of 0.040%), Immigrants from Mexico (44.5%, a difference of 0.060%), Mexican American Indian (44.5%, a difference of 0.060%), and Japanese (44.5%, a difference of 0.12%).
| Demographics | Rating | Rank | Currently Married |
| Iroquois | 1.1 /100 | #234 | Tragic 44.7% |
| Alaskan Athabascans | 0.9 /100 | #235 | Tragic 44.6% |
| Cubans | 0.9 /100 | #236 | Tragic 44.6% |
| Seminole | 0.9 /100 | #237 | Tragic 44.6% |
| Moroccans | 0.9 /100 | #238 | Tragic 44.6% |
| Immigrants | Mexico | 0.7 /100 | #239 | Tragic 44.5% |
| Mexican American Indians | 0.7 /100 | #240 | Tragic 44.5% |
| Ethiopians | 0.7 /100 | #241 | Tragic 44.5% |
| Immigrants | Cambodia | 0.7 /100 | #242 | Tragic 44.5% |
| Immigrants | Ethiopia | 0.7 /100 | #243 | Tragic 44.5% |
| Japanese | 0.6 /100 | #244 | Tragic 44.5% |
| Immigrants | Armenia | 0.4 /100 | #245 | Tragic 44.3% |
| Immigrants | Burma/Myanmar | 0.4 /100 | #246 | Tragic 44.3% |
| Ugandans | 0.4 /100 | #247 | Tragic 44.2% |
| Nicaraguans | 0.3 /100 | #248 | Tragic 44.2% |
Demographics Similar to Immigrants from Germany by Currently Married
In terms of currently married, the demographic groups most similar to Immigrants from Germany are Celtic (47.8%, a difference of 0.020%), Turkish (47.8%, a difference of 0.020%), Immigrants from Sweden (47.8%, a difference of 0.040%), Cypriot (47.8%, a difference of 0.050%), and Serbian (47.8%, a difference of 0.070%).
| Demographics | Rating | Rank | Currently Married |
| Native Hawaiians | 95.0 /100 | #94 | Exceptional 47.9% |
| Immigrants | Bulgaria | 94.8 /100 | #95 | Exceptional 47.9% |
| Egyptians | 94.8 /100 | #96 | Exceptional 47.9% |
| Immigrants | Ukraine | 94.8 /100 | #97 | Exceptional 47.9% |
| Immigrants | China | 94.7 /100 | #98 | Exceptional 47.9% |
| Immigrants | Sweden | 94.3 /100 | #99 | Exceptional 47.8% |
| Celtics | 94.2 /100 | #100 | Exceptional 47.8% |
| Immigrants | Germany | 94.1 /100 | #101 | Exceptional 47.8% |
| Turks | 93.9 /100 | #102 | Exceptional 47.8% |
| Cypriots | 93.7 /100 | #103 | Exceptional 47.8% |
| Serbians | 93.6 /100 | #104 | Exceptional 47.8% |
| Immigrants | Singapore | 93.3 /100 | #105 | Exceptional 47.8% |
| Immigrants | Greece | 93.1 /100 | #106 | Exceptional 47.7% |
| Immigrants | Italy | 92.9 /100 | #107 | Exceptional 47.7% |
| Tsimshian | 92.4 /100 | #108 | Exceptional 47.7% |