Ethiopian vs Immigrants from Latin America Currently Married
COMPARE
Ethiopian
Immigrants from Latin America
Currently Married
Currently Married Comparison
Ethiopians
Immigrants from Latin America
44.5%
CURRENTLY MARRIED
0.7/ 100
METRIC RATING
241st/ 347
METRIC RANK
43.8%
CURRENTLY MARRIED
0.1/ 100
METRIC RATING
260th/ 347
METRIC RANK
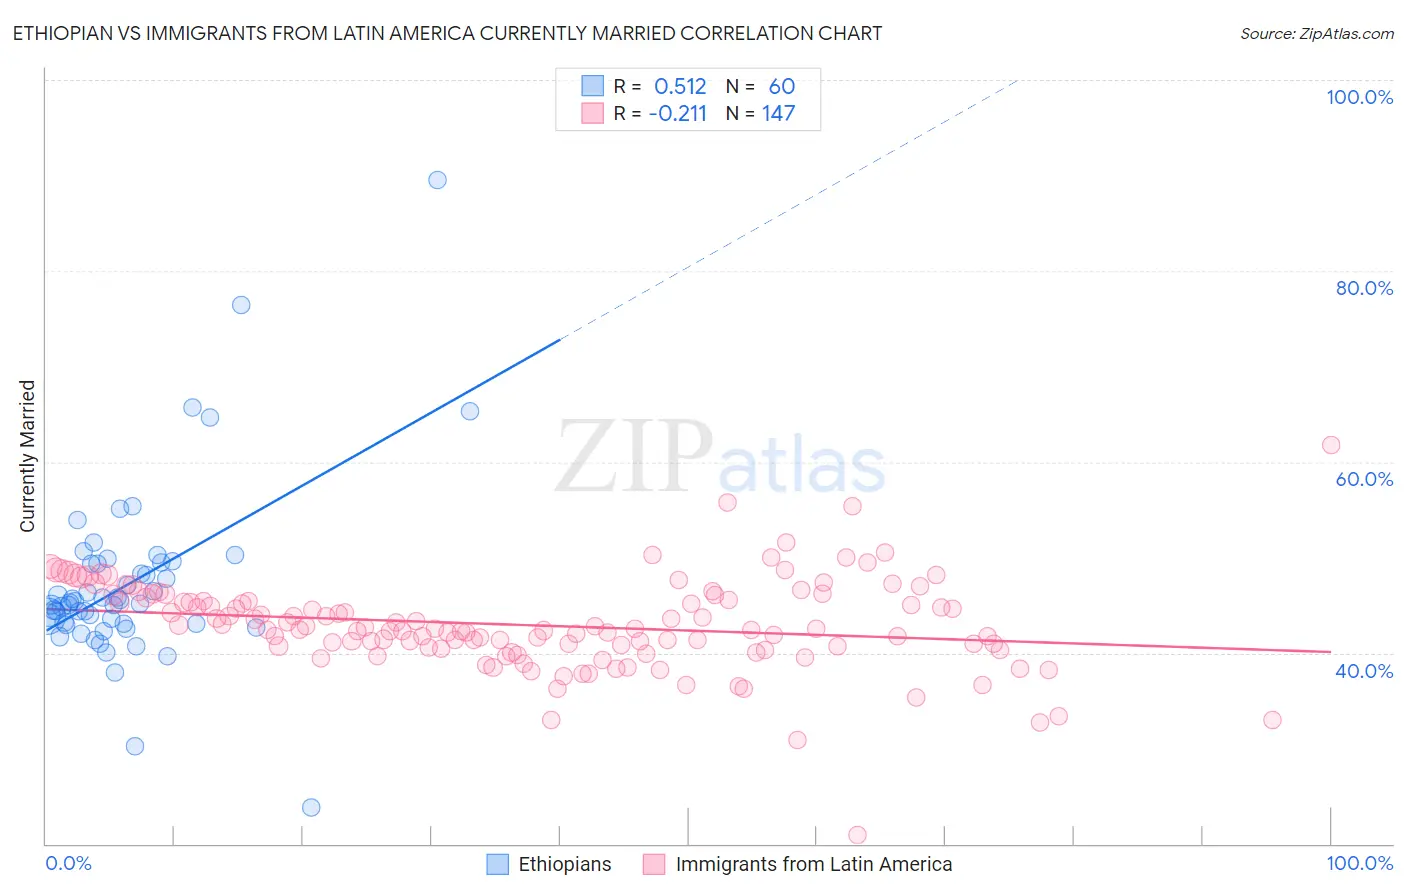
Ethiopian vs Immigrants from Latin America Currently Married Correlation Chart
The statistical analysis conducted on geographies consisting of 223,255,094 people shows a substantial positive correlation between the proportion of Ethiopians and percentage of population currently married in the United States with a correlation coefficient (R) of 0.512 and weighted average of 44.5%. Similarly, the statistical analysis conducted on geographies consisting of 558,538,971 people shows a weak negative correlation between the proportion of Immigrants from Latin America and percentage of population currently married in the United States with a correlation coefficient (R) of -0.211 and weighted average of 43.8%, a difference of 1.7%.
Currently Married Correlation Summary
| Measurement | Ethiopian | Immigrants from Latin America |
| Minimum | 23.8% | 20.9% |
| Maximum | 89.5% | 61.8% |
| Range | 65.7% | 40.9% |
| Mean | 47.3% | 42.9% |
| Median | 45.2% | 42.5% |
| Interquartile 25% (IQ1) | 43.0% | 40.6% |
| Interquartile 75% (IQ3) | 49.4% | 45.8% |
| Interquartile Range (IQR) | 6.3% | 5.2% |
| Standard Deviation (Sample) | 9.5% | 4.8% |
| Standard Deviation (Population) | 9.4% | 4.8% |
Demographics Similar to Ethiopians and Immigrants from Latin America by Currently Married
In terms of currently married, the demographic groups most similar to Ethiopians are Immigrants from Cambodia (44.5%, a difference of 0.030%), Immigrants from Ethiopia (44.5%, a difference of 0.040%), Mexican American Indian (44.5%, a difference of 0.060%), Japanese (44.5%, a difference of 0.12%), and Immigrants from Armenia (44.3%, a difference of 0.43%). Similarly, the demographic groups most similar to Immigrants from Latin America are Immigrants from Sierra Leone (43.8%, a difference of 0.060%), Ute (43.9%, a difference of 0.27%), Immigrants from Africa (43.9%, a difference of 0.28%), Shoshone (44.0%, a difference of 0.48%), and Yakama (44.0%, a difference of 0.53%).
| Demographics | Rating | Rank | Currently Married |
| Mexican American Indians | 0.7 /100 | #240 | Tragic 44.5% |
| Ethiopians | 0.7 /100 | #241 | Tragic 44.5% |
| Immigrants | Cambodia | 0.7 /100 | #242 | Tragic 44.5% |
| Immigrants | Ethiopia | 0.7 /100 | #243 | Tragic 44.5% |
| Japanese | 0.6 /100 | #244 | Tragic 44.5% |
| Immigrants | Armenia | 0.4 /100 | #245 | Tragic 44.3% |
| Immigrants | Burma/Myanmar | 0.4 /100 | #246 | Tragic 44.3% |
| Ugandans | 0.4 /100 | #247 | Tragic 44.2% |
| Nicaraguans | 0.3 /100 | #248 | Tragic 44.2% |
| Immigrants | Cameroon | 0.3 /100 | #249 | Tragic 44.2% |
| Immigrants | Eastern Africa | 0.3 /100 | #250 | Tragic 44.2% |
| Blackfeet | 0.3 /100 | #251 | Tragic 44.2% |
| Hispanics or Latinos | 0.3 /100 | #252 | Tragic 44.1% |
| Immigrants | Central America | 0.3 /100 | #253 | Tragic 44.1% |
| Vietnamese | 0.2 /100 | #254 | Tragic 44.0% |
| Yakama | 0.2 /100 | #255 | Tragic 44.0% |
| Shoshone | 0.2 /100 | #256 | Tragic 44.0% |
| Immigrants | Africa | 0.2 /100 | #257 | Tragic 43.9% |
| Ute | 0.2 /100 | #258 | Tragic 43.9% |
| Immigrants | Sierra Leone | 0.1 /100 | #259 | Tragic 43.8% |
| Immigrants | Latin America | 0.1 /100 | #260 | Tragic 43.8% |