Greek vs Immigrants from Germany Currently Married
COMPARE
Greek
Immigrants from Germany
Currently Married
Currently Married Comparison
Greeks
Immigrants from Germany
48.8%
CURRENTLY MARRIED
99.3/ 100
METRIC RATING
41st/ 347
METRIC RANK
47.8%
CURRENTLY MARRIED
94.1/ 100
METRIC RATING
101st/ 347
METRIC RANK
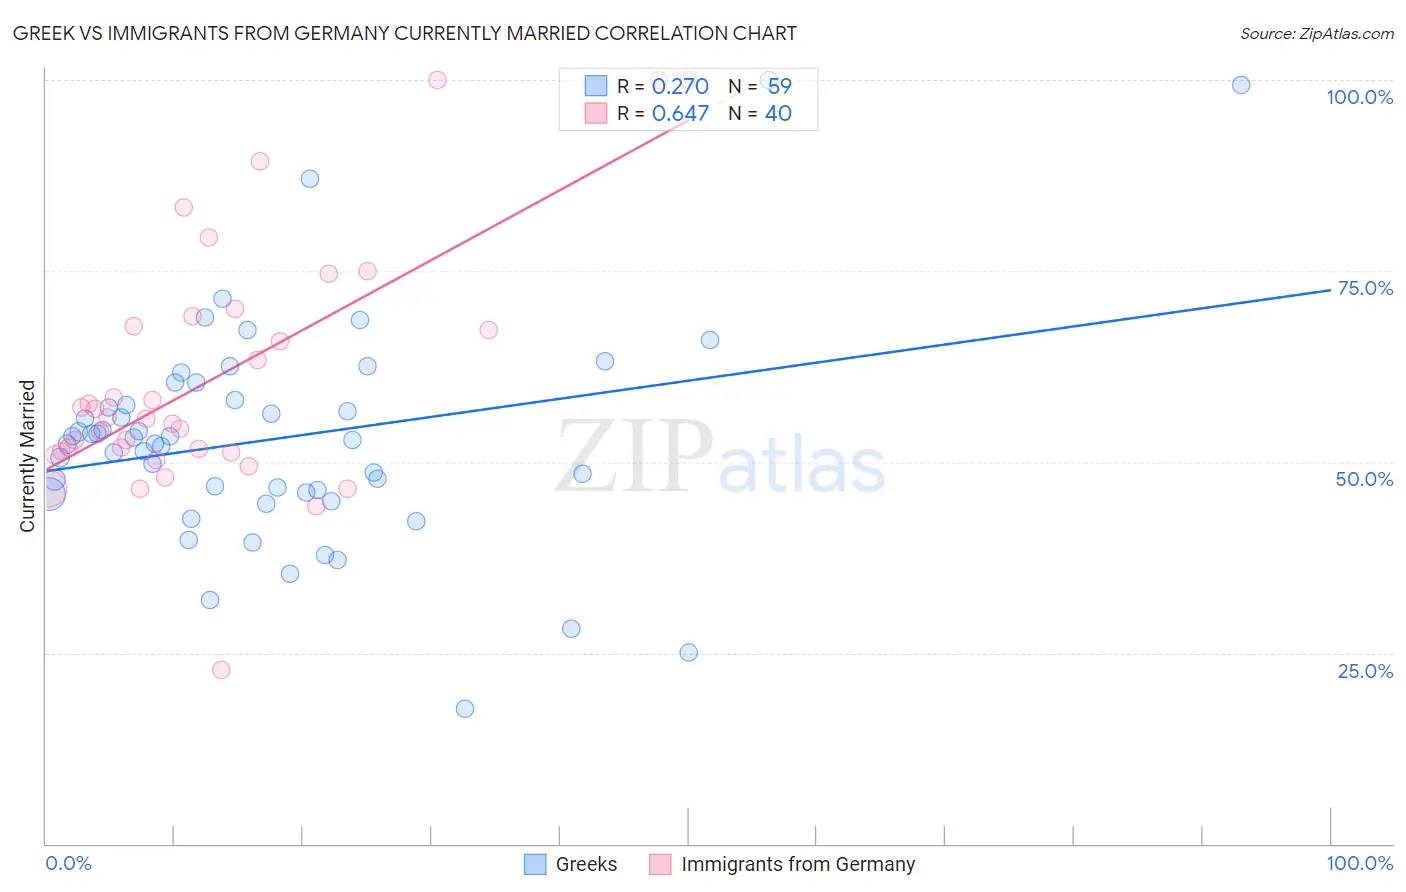
Greek vs Immigrants from Germany Currently Married Correlation Chart
The statistical analysis conducted on geographies consisting of 482,696,171 people shows a weak positive correlation between the proportion of Greeks and percentage of population currently married in the United States with a correlation coefficient (R) of 0.270 and weighted average of 48.8%. Similarly, the statistical analysis conducted on geographies consisting of 463,859,108 people shows a significant positive correlation between the proportion of Immigrants from Germany and percentage of population currently married in the United States with a correlation coefficient (R) of 0.647 and weighted average of 47.8%, a difference of 2.0%.
Currently Married Correlation Summary
| Measurement | Greek | Immigrants from Germany |
| Minimum | 17.7% | 22.7% |
| Maximum | 100.0% | 100.0% |
| Range | 82.3% | 77.3% |
| Mean | 53.0% | 60.9% |
| Median | 52.8% | 55.7% |
| Interquartile 25% (IQ1) | 46.0% | 51.4% |
| Interquartile 75% (IQ3) | 58.1% | 68.4% |
| Interquartile Range (IQR) | 12.1% | 17.0% |
| Standard Deviation (Sample) | 14.5% | 16.5% |
| Standard Deviation (Population) | 14.4% | 16.3% |
Similar Demographics by Currently Married
Demographics Similar to Greeks by Currently Married
In terms of currently married, the demographic groups most similar to Greeks are Immigrants from Canada (48.8%, a difference of 0.020%), British (48.8%, a difference of 0.040%), Finnish (48.8%, a difference of 0.050%), Scotch-Irish (48.7%, a difference of 0.050%), and Czechoslovakian (48.8%, a difference of 0.070%).
| Demographics | Rating | Rank | Currently Married |
| Immigrants | Lithuania | 99.4 /100 | #34 | Exceptional 48.8% |
| Immigrants | Northern Europe | 99.4 /100 | #35 | Exceptional 48.8% |
| Italians | 99.4 /100 | #36 | Exceptional 48.8% |
| Hungarians | 99.4 /100 | #37 | Exceptional 48.8% |
| Czechoslovakians | 99.4 /100 | #38 | Exceptional 48.8% |
| British | 99.4 /100 | #39 | Exceptional 48.8% |
| Immigrants | Canada | 99.4 /100 | #40 | Exceptional 48.8% |
| Greeks | 99.3 /100 | #41 | Exceptional 48.8% |
| Finns | 99.3 /100 | #42 | Exceptional 48.8% |
| Scotch-Irish | 99.3 /100 | #43 | Exceptional 48.7% |
| Immigrants | North America | 99.3 /100 | #44 | Exceptional 48.7% |
| Belgians | 99.3 /100 | #45 | Exceptional 48.7% |
| Immigrants | Iran | 99.2 /100 | #46 | Exceptional 48.7% |
| Northern Europeans | 99.2 /100 | #47 | Exceptional 48.7% |
| Austrians | 99.2 /100 | #48 | Exceptional 48.7% |
Demographics Similar to Immigrants from Germany by Currently Married
In terms of currently married, the demographic groups most similar to Immigrants from Germany are Celtic (47.8%, a difference of 0.020%), Turkish (47.8%, a difference of 0.020%), Immigrants from Sweden (47.8%, a difference of 0.040%), Cypriot (47.8%, a difference of 0.050%), and Serbian (47.8%, a difference of 0.070%).
| Demographics | Rating | Rank | Currently Married |
| Native Hawaiians | 95.0 /100 | #94 | Exceptional 47.9% |
| Immigrants | Bulgaria | 94.8 /100 | #95 | Exceptional 47.9% |
| Egyptians | 94.8 /100 | #96 | Exceptional 47.9% |
| Immigrants | Ukraine | 94.8 /100 | #97 | Exceptional 47.9% |
| Immigrants | China | 94.7 /100 | #98 | Exceptional 47.9% |
| Immigrants | Sweden | 94.3 /100 | #99 | Exceptional 47.8% |
| Celtics | 94.2 /100 | #100 | Exceptional 47.8% |
| Immigrants | Germany | 94.1 /100 | #101 | Exceptional 47.8% |
| Turks | 93.9 /100 | #102 | Exceptional 47.8% |
| Cypriots | 93.7 /100 | #103 | Exceptional 47.8% |
| Serbians | 93.6 /100 | #104 | Exceptional 47.8% |
| Immigrants | Singapore | 93.3 /100 | #105 | Exceptional 47.8% |
| Immigrants | Greece | 93.1 /100 | #106 | Exceptional 47.7% |
| Immigrants | Italy | 92.9 /100 | #107 | Exceptional 47.7% |
| Tsimshian | 92.4 /100 | #108 | Exceptional 47.7% |