Chippewa vs Immigrants from Germany Currently Married
COMPARE
Chippewa
Immigrants from Germany
Currently Married
Currently Married Comparison
Chippewa
Immigrants from Germany
43.2%
CURRENTLY MARRIED
0.0/ 100
METRIC RATING
281st/ 347
METRIC RANK
47.8%
CURRENTLY MARRIED
94.1/ 100
METRIC RATING
101st/ 347
METRIC RANK
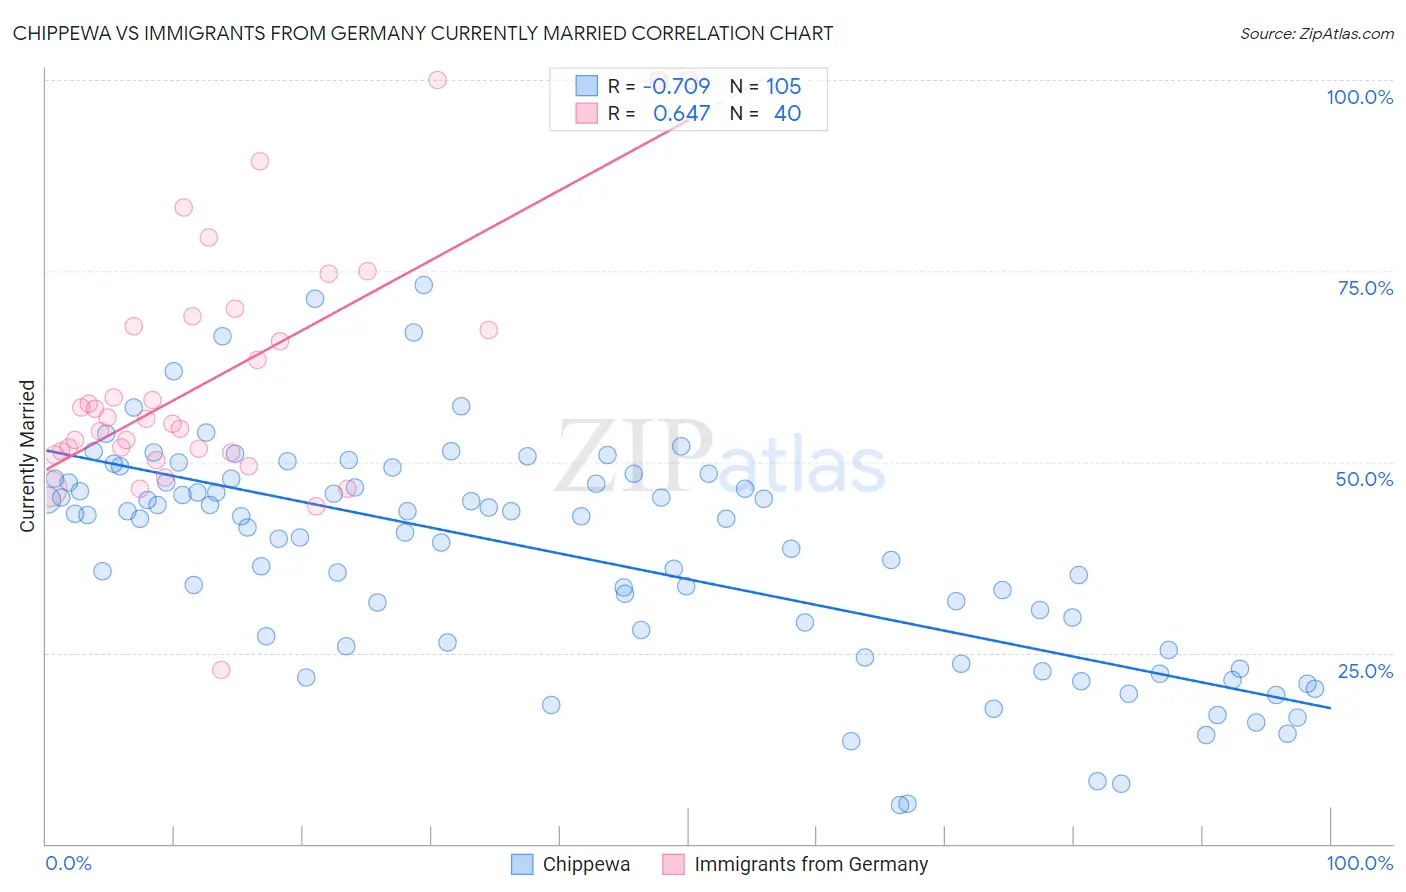
Chippewa vs Immigrants from Germany Currently Married Correlation Chart
The statistical analysis conducted on geographies consisting of 215,057,083 people shows a strong negative correlation between the proportion of Chippewa and percentage of population currently married in the United States with a correlation coefficient (R) of -0.709 and weighted average of 43.2%. Similarly, the statistical analysis conducted on geographies consisting of 463,859,108 people shows a significant positive correlation between the proportion of Immigrants from Germany and percentage of population currently married in the United States with a correlation coefficient (R) of 0.647 and weighted average of 47.8%, a difference of 10.6%.
Currently Married Correlation Summary
| Measurement | Chippewa | Immigrants from Germany |
| Minimum | 5.1% | 22.7% |
| Maximum | 73.1% | 100.0% |
| Range | 68.0% | 77.3% |
| Mean | 38.0% | 60.9% |
| Median | 42.5% | 55.7% |
| Interquartile 25% (IQ1) | 26.1% | 51.4% |
| Interquartile 75% (IQ3) | 47.6% | 68.4% |
| Interquartile Range (IQR) | 21.5% | 17.0% |
| Standard Deviation (Sample) | 14.5% | 16.5% |
| Standard Deviation (Population) | 14.4% | 16.3% |
Similar Demographics by Currently Married
Demographics Similar to Chippewa by Currently Married
In terms of currently married, the demographic groups most similar to Chippewa are Apache (43.2%, a difference of 0.010%), Immigrants from Ecuador (43.2%, a difference of 0.070%), Central American Indian (43.3%, a difference of 0.080%), Kiowa (43.2%, a difference of 0.19%), and Immigrants from El Salvador (43.1%, a difference of 0.20%).
| Demographics | Rating | Rank | Currently Married |
| Nigerians | 0.1 /100 | #274 | Tragic 43.4% |
| Colville | 0.1 /100 | #275 | Tragic 43.4% |
| Sierra Leoneans | 0.1 /100 | #276 | Tragic 43.4% |
| Immigrants | Nigeria | 0.1 /100 | #277 | Tragic 43.4% |
| Central Americans | 0.0 /100 | #278 | Tragic 43.3% |
| Central American Indians | 0.0 /100 | #279 | Tragic 43.3% |
| Apache | 0.0 /100 | #280 | Tragic 43.2% |
| Chippewa | 0.0 /100 | #281 | Tragic 43.2% |
| Immigrants | Ecuador | 0.0 /100 | #282 | Tragic 43.2% |
| Kiowa | 0.0 /100 | #283 | Tragic 43.2% |
| Immigrants | El Salvador | 0.0 /100 | #284 | Tragic 43.1% |
| Immigrants | Middle Africa | 0.0 /100 | #285 | Tragic 43.0% |
| Ghanaians | 0.0 /100 | #286 | Tragic 42.9% |
| Guatemalans | 0.0 /100 | #287 | Tragic 42.9% |
| Natives/Alaskans | 0.0 /100 | #288 | Tragic 42.8% |
Demographics Similar to Immigrants from Germany by Currently Married
In terms of currently married, the demographic groups most similar to Immigrants from Germany are Celtic (47.8%, a difference of 0.020%), Turkish (47.8%, a difference of 0.020%), Immigrants from Sweden (47.8%, a difference of 0.040%), Cypriot (47.8%, a difference of 0.050%), and Serbian (47.8%, a difference of 0.070%).
| Demographics | Rating | Rank | Currently Married |
| Native Hawaiians | 95.0 /100 | #94 | Exceptional 47.9% |
| Immigrants | Bulgaria | 94.8 /100 | #95 | Exceptional 47.9% |
| Egyptians | 94.8 /100 | #96 | Exceptional 47.9% |
| Immigrants | Ukraine | 94.8 /100 | #97 | Exceptional 47.9% |
| Immigrants | China | 94.7 /100 | #98 | Exceptional 47.9% |
| Immigrants | Sweden | 94.3 /100 | #99 | Exceptional 47.8% |
| Celtics | 94.2 /100 | #100 | Exceptional 47.8% |
| Immigrants | Germany | 94.1 /100 | #101 | Exceptional 47.8% |
| Turks | 93.9 /100 | #102 | Exceptional 47.8% |
| Cypriots | 93.7 /100 | #103 | Exceptional 47.8% |
| Serbians | 93.6 /100 | #104 | Exceptional 47.8% |
| Immigrants | Singapore | 93.3 /100 | #105 | Exceptional 47.8% |
| Immigrants | Greece | 93.1 /100 | #106 | Exceptional 47.7% |
| Immigrants | Italy | 92.9 /100 | #107 | Exceptional 47.7% |
| Tsimshian | 92.4 /100 | #108 | Exceptional 47.7% |