Ethiopian vs Immigrants from Germany Male Unemployment
COMPARE
Ethiopian
Immigrants from Germany
Male Unemployment
Male Unemployment Comparison
Ethiopians
Immigrants from Germany
5.1%
MALE UNEMPLOYMENT
91.3/ 100
METRIC RATING
107th/ 347
METRIC RANK
5.2%
MALE UNEMPLOYMENT
83.0/ 100
METRIC RATING
131st/ 347
METRIC RANK
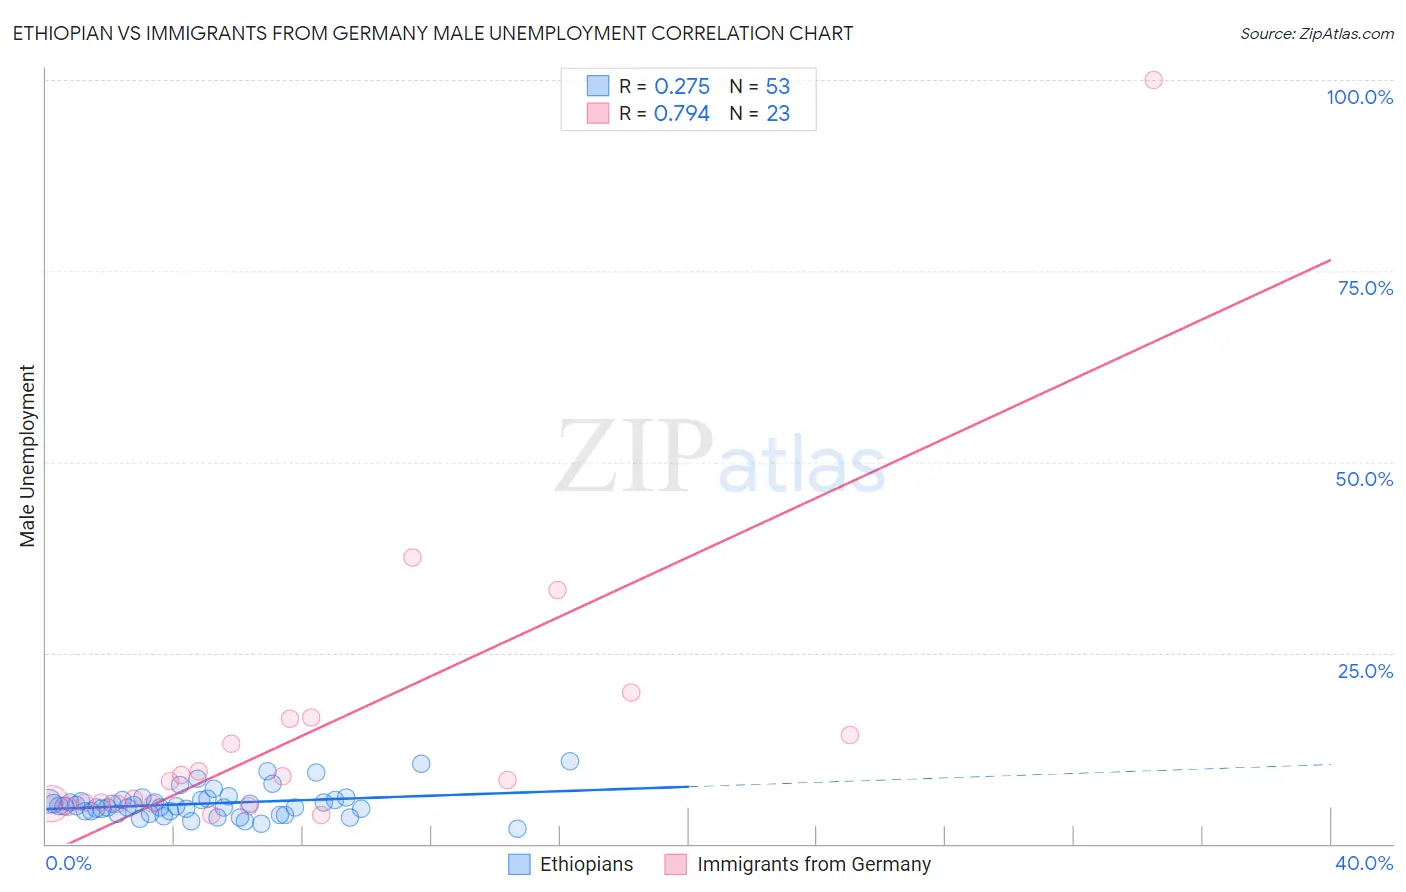
Ethiopian vs Immigrants from Germany Male Unemployment Correlation Chart
The statistical analysis conducted on geographies consisting of 222,844,986 people shows a weak positive correlation between the proportion of Ethiopians and unemployment rate among males in the United States with a correlation coefficient (R) of 0.275 and weighted average of 5.1%. Similarly, the statistical analysis conducted on geographies consisting of 460,829,460 people shows a strong positive correlation between the proportion of Immigrants from Germany and unemployment rate among males in the United States with a correlation coefficient (R) of 0.794 and weighted average of 5.2%, a difference of 1.1%.
Male Unemployment Correlation Summary
| Measurement | Ethiopian | Immigrants from Germany |
| Minimum | 1.9% | 3.8% |
| Maximum | 10.8% | 100.0% |
| Range | 8.9% | 96.2% |
| Mean | 5.3% | 15.0% |
| Median | 4.9% | 8.3% |
| Interquartile 25% (IQ1) | 4.1% | 5.2% |
| Interquartile 75% (IQ3) | 5.8% | 16.4% |
| Interquartile Range (IQR) | 1.7% | 11.2% |
| Standard Deviation (Sample) | 1.9% | 20.6% |
| Standard Deviation (Population) | 1.9% | 20.1% |
Similar Demographics by Male Unemployment
Demographics Similar to Ethiopians by Male Unemployment
In terms of male unemployment, the demographic groups most similar to Ethiopians are Immigrants from Nicaragua (5.1%, a difference of 0.010%), Immigrants from Ethiopia (5.1%, a difference of 0.040%), Immigrants from Pakistan (5.1%, a difference of 0.070%), Immigrants from Czechoslovakia (5.1%, a difference of 0.080%), and Immigrants from Chile (5.1%, a difference of 0.090%).
| Demographics | Rating | Rank | Male Unemployment |
| Russians | 92.9 /100 | #100 | Exceptional 5.1% |
| German Russians | 92.7 /100 | #101 | Exceptional 5.1% |
| Immigrants | France | 92.7 /100 | #102 | Exceptional 5.1% |
| Immigrants | Jordan | 91.9 /100 | #103 | Exceptional 5.1% |
| Immigrants | Chile | 91.8 /100 | #104 | Exceptional 5.1% |
| Immigrants | Czechoslovakia | 91.7 /100 | #105 | Exceptional 5.1% |
| Immigrants | Ethiopia | 91.5 /100 | #106 | Exceptional 5.1% |
| Ethiopians | 91.3 /100 | #107 | Exceptional 5.1% |
| Immigrants | Nicaragua | 91.2 /100 | #108 | Exceptional 5.1% |
| Immigrants | Pakistan | 90.9 /100 | #109 | Exceptional 5.1% |
| Immigrants | England | 90.8 /100 | #110 | Exceptional 5.1% |
| Immigrants | Eastern Asia | 90.8 /100 | #111 | Exceptional 5.1% |
| Immigrants | Moldova | 90.3 /100 | #112 | Exceptional 5.1% |
| Immigrants | Austria | 90.3 /100 | #113 | Exceptional 5.1% |
| Romanians | 89.8 /100 | #114 | Excellent 5.1% |
Demographics Similar to Immigrants from Germany by Male Unemployment
In terms of male unemployment, the demographic groups most similar to Immigrants from Germany are Chickasaw (5.2%, a difference of 0.020%), Immigrants from Malaysia (5.2%, a difference of 0.050%), Immigrants from Western Europe (5.2%, a difference of 0.20%), Colombian (5.2%, a difference of 0.20%), and Hungarian (5.2%, a difference of 0.23%).
| Demographics | Rating | Rank | Male Unemployment |
| Immigrants | Latvia | 87.5 /100 | #124 | Excellent 5.1% |
| Immigrants | Lithuania | 87.2 /100 | #125 | Excellent 5.1% |
| Immigrants | Colombia | 86.8 /100 | #126 | Excellent 5.1% |
| Immigrants | Brazil | 86.3 /100 | #127 | Excellent 5.2% |
| Hungarians | 85.1 /100 | #128 | Excellent 5.2% |
| Immigrants | Western Europe | 84.8 /100 | #129 | Excellent 5.2% |
| Immigrants | Malaysia | 83.5 /100 | #130 | Excellent 5.2% |
| Immigrants | Germany | 83.0 /100 | #131 | Excellent 5.2% |
| Chickasaw | 82.9 /100 | #132 | Excellent 5.2% |
| Colombians | 81.1 /100 | #133 | Excellent 5.2% |
| Pakistanis | 80.5 /100 | #134 | Excellent 5.2% |
| Immigrants | Saudi Arabia | 80.1 /100 | #135 | Excellent 5.2% |
| Lebanese | 79.9 /100 | #136 | Good 5.2% |
| Immigrants | Eastern Africa | 79.8 /100 | #137 | Good 5.2% |
| Immigrants | Croatia | 79.7 /100 | #138 | Good 5.2% |