Ethiopian vs Immigrants from Micronesia Currently Married
COMPARE
Ethiopian
Immigrants from Micronesia
Currently Married
Currently Married Comparison
Ethiopians
Immigrants from Micronesia
44.5%
CURRENTLY MARRIED
0.7/ 100
METRIC RATING
241st/ 347
METRIC RANK
45.6%
CURRENTLY MARRIED
8.8/ 100
METRIC RATING
209th/ 347
METRIC RANK
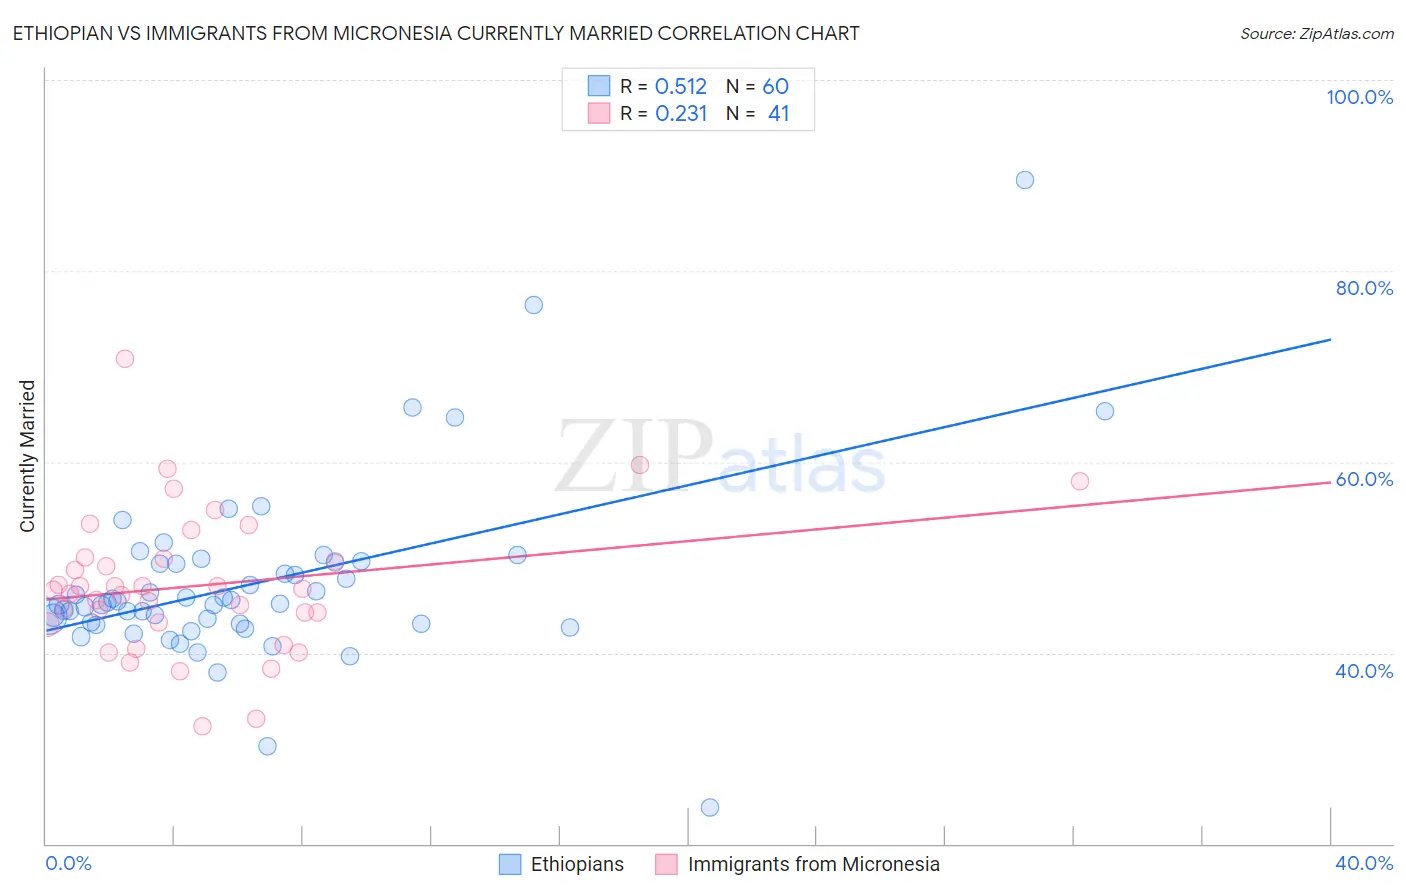
Ethiopian vs Immigrants from Micronesia Currently Married Correlation Chart
The statistical analysis conducted on geographies consisting of 223,255,094 people shows a substantial positive correlation between the proportion of Ethiopians and percentage of population currently married in the United States with a correlation coefficient (R) of 0.512 and weighted average of 44.5%. Similarly, the statistical analysis conducted on geographies consisting of 61,606,735 people shows a weak positive correlation between the proportion of Immigrants from Micronesia and percentage of population currently married in the United States with a correlation coefficient (R) of 0.231 and weighted average of 45.6%, a difference of 2.5%.
Currently Married Correlation Summary
| Measurement | Ethiopian | Immigrants from Micronesia |
| Minimum | 23.8% | 32.3% |
| Maximum | 89.5% | 70.8% |
| Range | 65.7% | 38.5% |
| Mean | 47.3% | 47.1% |
| Median | 45.2% | 46.5% |
| Interquartile 25% (IQ1) | 43.0% | 43.1% |
| Interquartile 75% (IQ3) | 49.4% | 49.9% |
| Interquartile Range (IQR) | 6.3% | 6.8% |
| Standard Deviation (Sample) | 9.5% | 7.4% |
| Standard Deviation (Population) | 9.4% | 7.3% |
Similar Demographics by Currently Married
Demographics Similar to Ethiopians by Currently Married
In terms of currently married, the demographic groups most similar to Ethiopians are Immigrants from Cambodia (44.5%, a difference of 0.030%), Immigrants from Ethiopia (44.5%, a difference of 0.040%), Immigrants from Mexico (44.5%, a difference of 0.060%), Mexican American Indian (44.5%, a difference of 0.060%), and Japanese (44.5%, a difference of 0.12%).
| Demographics | Rating | Rank | Currently Married |
| Iroquois | 1.1 /100 | #234 | Tragic 44.7% |
| Alaskan Athabascans | 0.9 /100 | #235 | Tragic 44.6% |
| Cubans | 0.9 /100 | #236 | Tragic 44.6% |
| Seminole | 0.9 /100 | #237 | Tragic 44.6% |
| Moroccans | 0.9 /100 | #238 | Tragic 44.6% |
| Immigrants | Mexico | 0.7 /100 | #239 | Tragic 44.5% |
| Mexican American Indians | 0.7 /100 | #240 | Tragic 44.5% |
| Ethiopians | 0.7 /100 | #241 | Tragic 44.5% |
| Immigrants | Cambodia | 0.7 /100 | #242 | Tragic 44.5% |
| Immigrants | Ethiopia | 0.7 /100 | #243 | Tragic 44.5% |
| Japanese | 0.6 /100 | #244 | Tragic 44.5% |
| Immigrants | Armenia | 0.4 /100 | #245 | Tragic 44.3% |
| Immigrants | Burma/Myanmar | 0.4 /100 | #246 | Tragic 44.3% |
| Ugandans | 0.4 /100 | #247 | Tragic 44.2% |
| Nicaraguans | 0.3 /100 | #248 | Tragic 44.2% |
Demographics Similar to Immigrants from Micronesia by Currently Married
In terms of currently married, the demographic groups most similar to Immigrants from Micronesia are Uruguayan (45.6%, a difference of 0.11%), Houma (45.5%, a difference of 0.20%), Marshallese (45.5%, a difference of 0.20%), Alsatian (45.7%, a difference of 0.21%), and Immigrants from South America (45.7%, a difference of 0.22%).
| Demographics | Rating | Rank | Currently Married |
| Immigrants | Albania | 14.5 /100 | #202 | Poor 45.9% |
| Taiwanese | 11.7 /100 | #203 | Poor 45.8% |
| Immigrants | Spain | 11.6 /100 | #204 | Poor 45.8% |
| South American Indians | 11.5 /100 | #205 | Poor 45.8% |
| Immigrants | Immigrants | 11.2 /100 | #206 | Poor 45.8% |
| Immigrants | South America | 10.8 /100 | #207 | Poor 45.7% |
| Alsatians | 10.8 /100 | #208 | Poor 45.7% |
| Immigrants | Micronesia | 8.8 /100 | #209 | Tragic 45.6% |
| Uruguayans | 7.9 /100 | #210 | Tragic 45.6% |
| Houma | 7.2 /100 | #211 | Tragic 45.5% |
| Marshallese | 7.2 /100 | #212 | Tragic 45.5% |
| Alaska Natives | 7.0 /100 | #213 | Tragic 45.5% |
| Dutch West Indians | 6.7 /100 | #214 | Tragic 45.5% |
| German Russians | 6.7 /100 | #215 | Tragic 45.5% |
| Immigrants | Morocco | 5.5 /100 | #216 | Tragic 45.4% |