Ethiopian vs Immigrants from Saudi Arabia Currently Married
COMPARE
Ethiopian
Immigrants from Saudi Arabia
Currently Married
Currently Married Comparison
Ethiopians
Immigrants from Saudi Arabia
44.5%
CURRENTLY MARRIED
0.7/ 100
METRIC RATING
241st/ 347
METRIC RANK
44.7%
CURRENTLY MARRIED
1.1/ 100
METRIC RATING
233rd/ 347
METRIC RANK
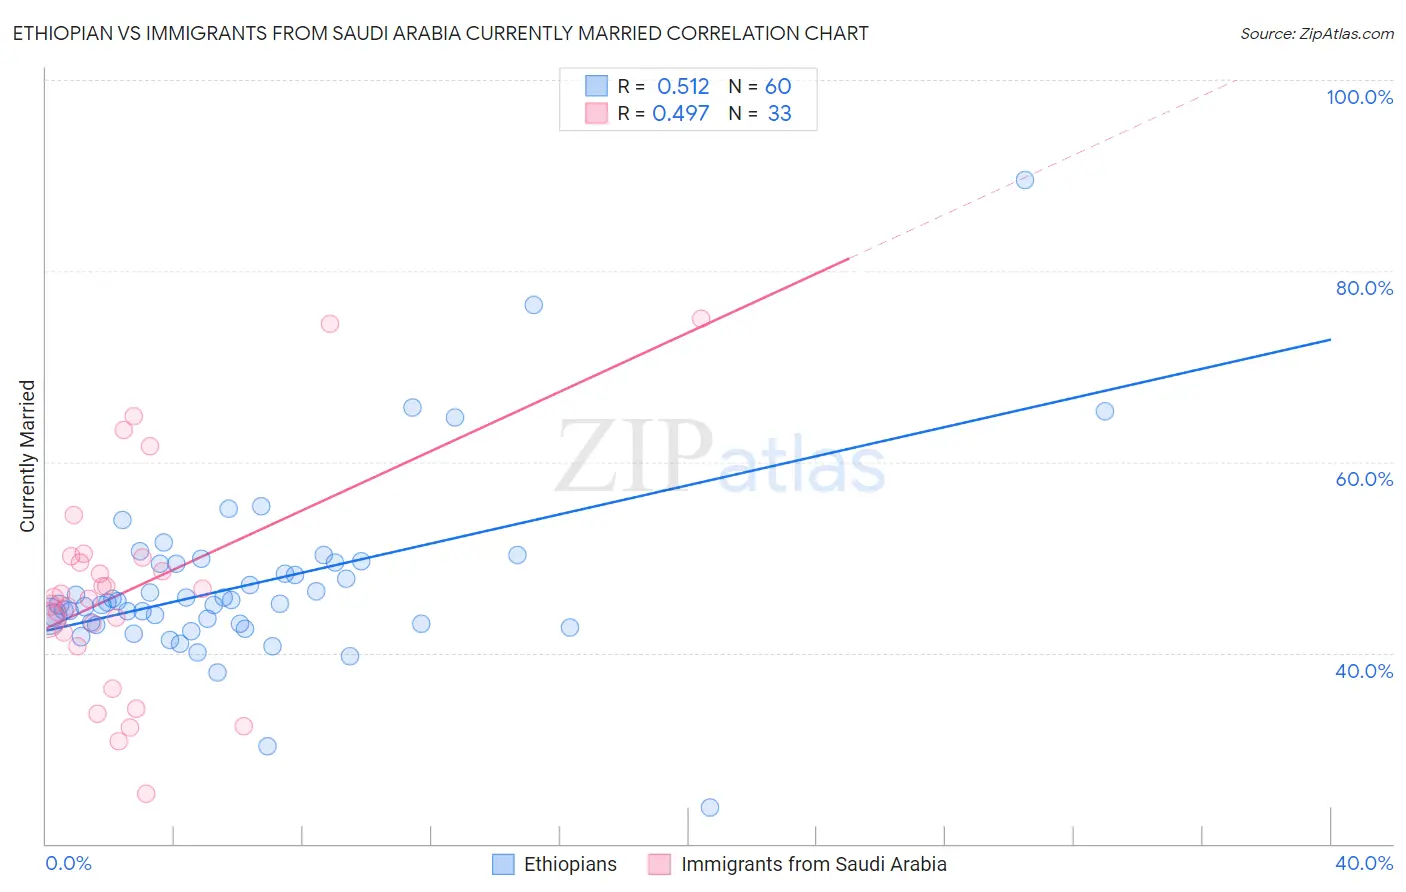
Ethiopian vs Immigrants from Saudi Arabia Currently Married Correlation Chart
The statistical analysis conducted on geographies consisting of 223,255,094 people shows a substantial positive correlation between the proportion of Ethiopians and percentage of population currently married in the United States with a correlation coefficient (R) of 0.512 and weighted average of 44.5%. Similarly, the statistical analysis conducted on geographies consisting of 164,277,877 people shows a moderate positive correlation between the proportion of Immigrants from Saudi Arabia and percentage of population currently married in the United States with a correlation coefficient (R) of 0.497 and weighted average of 44.7%, a difference of 0.46%.
Currently Married Correlation Summary
| Measurement | Ethiopian | Immigrants from Saudi Arabia |
| Minimum | 23.8% | 25.2% |
| Maximum | 89.5% | 75.0% |
| Range | 65.7% | 49.8% |
| Mean | 47.3% | 46.7% |
| Median | 45.2% | 45.8% |
| Interquartile 25% (IQ1) | 43.0% | 41.4% |
| Interquartile 75% (IQ3) | 49.4% | 50.1% |
| Interquartile Range (IQR) | 6.3% | 8.7% |
| Standard Deviation (Sample) | 9.5% | 11.4% |
| Standard Deviation (Population) | 9.4% | 11.3% |
Demographics Similar to Ethiopians and Immigrants from Saudi Arabia by Currently Married
In terms of currently married, the demographic groups most similar to Ethiopians are Immigrants from Cambodia (44.5%, a difference of 0.030%), Immigrants from Ethiopia (44.5%, a difference of 0.040%), Immigrants from Mexico (44.5%, a difference of 0.060%), Mexican American Indian (44.5%, a difference of 0.060%), and Japanese (44.5%, a difference of 0.12%). Similarly, the demographic groups most similar to Immigrants from Saudi Arabia are Iroquois (44.7%, a difference of 0.010%), Nepalese (44.7%, a difference of 0.050%), Alaskan Athabascan (44.6%, a difference of 0.16%), Cuban (44.6%, a difference of 0.17%), and Seminole (44.6%, a difference of 0.18%).
| Demographics | Rating | Rank | Currently Married |
| Spanish Americans | 2.1 /100 | #227 | Tragic 45.0% |
| Immigrants | Uruguay | 2.0 /100 | #228 | Tragic 45.0% |
| Cree | 1.7 /100 | #229 | Tragic 44.9% |
| Immigrants | Kenya | 1.6 /100 | #230 | Tragic 44.9% |
| Immigrants | Panama | 1.5 /100 | #231 | Tragic 44.9% |
| Nepalese | 1.2 /100 | #232 | Tragic 44.7% |
| Immigrants | Saudi Arabia | 1.1 /100 | #233 | Tragic 44.7% |
| Iroquois | 1.1 /100 | #234 | Tragic 44.7% |
| Alaskan Athabascans | 0.9 /100 | #235 | Tragic 44.6% |
| Cubans | 0.9 /100 | #236 | Tragic 44.6% |
| Seminole | 0.9 /100 | #237 | Tragic 44.6% |
| Moroccans | 0.9 /100 | #238 | Tragic 44.6% |
| Immigrants | Mexico | 0.7 /100 | #239 | Tragic 44.5% |
| Mexican American Indians | 0.7 /100 | #240 | Tragic 44.5% |
| Ethiopians | 0.7 /100 | #241 | Tragic 44.5% |
| Immigrants | Cambodia | 0.7 /100 | #242 | Tragic 44.5% |
| Immigrants | Ethiopia | 0.7 /100 | #243 | Tragic 44.5% |
| Japanese | 0.6 /100 | #244 | Tragic 44.5% |
| Immigrants | Armenia | 0.4 /100 | #245 | Tragic 44.3% |
| Immigrants | Burma/Myanmar | 0.4 /100 | #246 | Tragic 44.3% |
| Ugandans | 0.4 /100 | #247 | Tragic 44.2% |