Ethiopian vs Immigrants from North America Currently Married
COMPARE
Ethiopian
Immigrants from North America
Currently Married
Currently Married Comparison
Ethiopians
Immigrants from North America
44.5%
CURRENTLY MARRIED
0.7/ 100
METRIC RATING
241st/ 347
METRIC RANK
48.7%
CURRENTLY MARRIED
99.3/ 100
METRIC RATING
44th/ 347
METRIC RANK
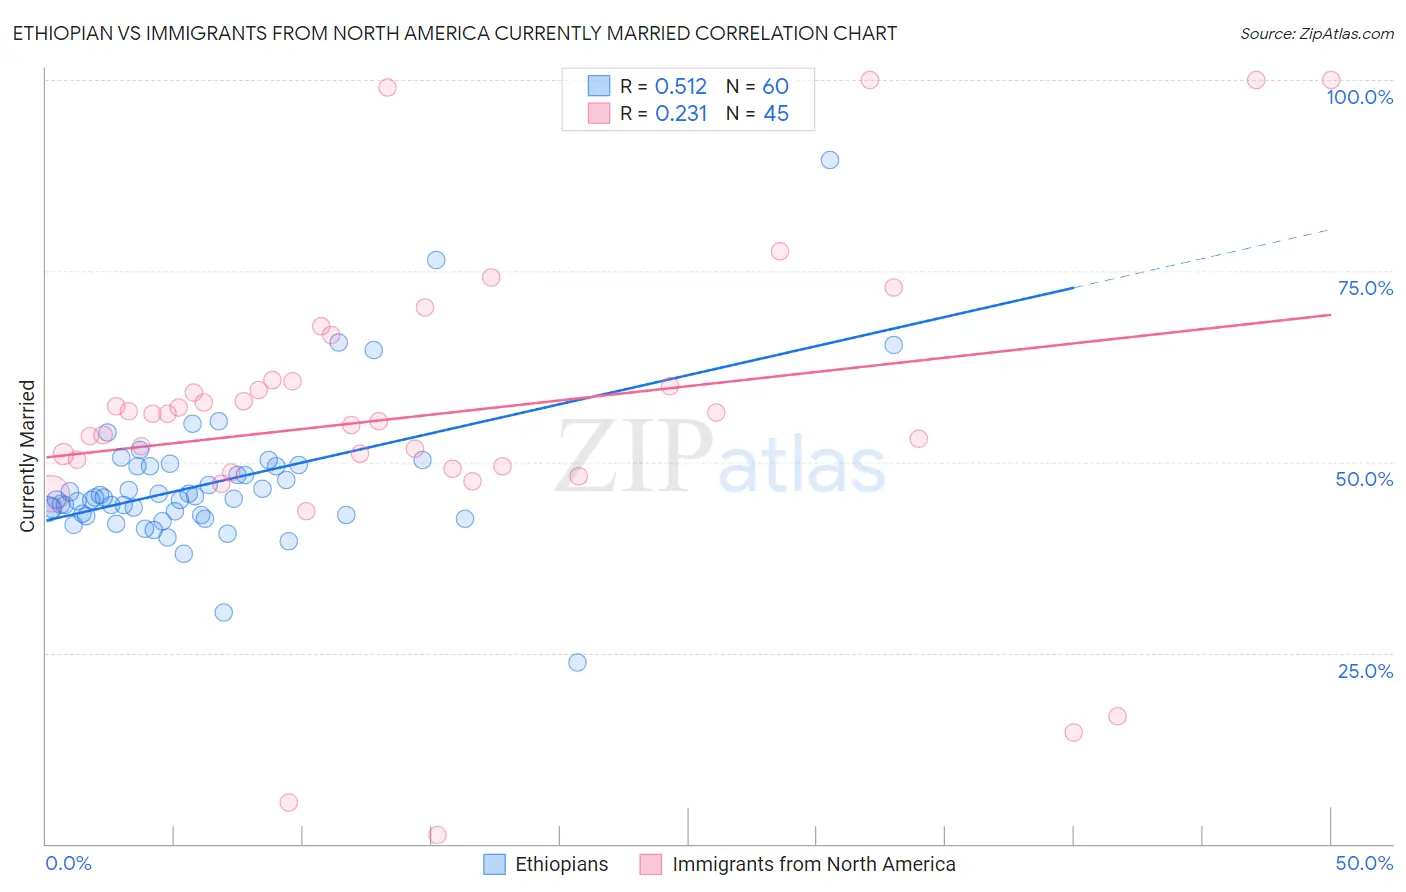
Ethiopian vs Immigrants from North America Currently Married Correlation Chart
The statistical analysis conducted on geographies consisting of 223,255,094 people shows a substantial positive correlation between the proportion of Ethiopians and percentage of population currently married in the United States with a correlation coefficient (R) of 0.512 and weighted average of 44.5%. Similarly, the statistical analysis conducted on geographies consisting of 462,399,389 people shows a weak positive correlation between the proportion of Immigrants from North America and percentage of population currently married in the United States with a correlation coefficient (R) of 0.231 and weighted average of 48.7%, a difference of 9.5%.
Currently Married Correlation Summary
| Measurement | Ethiopian | Immigrants from North America |
| Minimum | 23.8% | 1.1% |
| Maximum | 89.5% | 100.0% |
| Range | 65.7% | 98.9% |
| Mean | 47.3% | 56.2% |
| Median | 45.2% | 56.2% |
| Interquartile 25% (IQ1) | 43.0% | 49.3% |
| Interquartile 75% (IQ3) | 49.4% | 60.6% |
| Interquartile Range (IQR) | 6.3% | 11.4% |
| Standard Deviation (Sample) | 9.5% | 20.7% |
| Standard Deviation (Population) | 9.4% | 20.5% |
Similar Demographics by Currently Married
Demographics Similar to Ethiopians by Currently Married
In terms of currently married, the demographic groups most similar to Ethiopians are Immigrants from Cambodia (44.5%, a difference of 0.030%), Immigrants from Ethiopia (44.5%, a difference of 0.040%), Immigrants from Mexico (44.5%, a difference of 0.060%), Mexican American Indian (44.5%, a difference of 0.060%), and Japanese (44.5%, a difference of 0.12%).
| Demographics | Rating | Rank | Currently Married |
| Iroquois | 1.1 /100 | #234 | Tragic 44.7% |
| Alaskan Athabascans | 0.9 /100 | #235 | Tragic 44.6% |
| Cubans | 0.9 /100 | #236 | Tragic 44.6% |
| Seminole | 0.9 /100 | #237 | Tragic 44.6% |
| Moroccans | 0.9 /100 | #238 | Tragic 44.6% |
| Immigrants | Mexico | 0.7 /100 | #239 | Tragic 44.5% |
| Mexican American Indians | 0.7 /100 | #240 | Tragic 44.5% |
| Ethiopians | 0.7 /100 | #241 | Tragic 44.5% |
| Immigrants | Cambodia | 0.7 /100 | #242 | Tragic 44.5% |
| Immigrants | Ethiopia | 0.7 /100 | #243 | Tragic 44.5% |
| Japanese | 0.6 /100 | #244 | Tragic 44.5% |
| Immigrants | Armenia | 0.4 /100 | #245 | Tragic 44.3% |
| Immigrants | Burma/Myanmar | 0.4 /100 | #246 | Tragic 44.3% |
| Ugandans | 0.4 /100 | #247 | Tragic 44.2% |
| Nicaraguans | 0.3 /100 | #248 | Tragic 44.2% |
Demographics Similar to Immigrants from North America by Currently Married
In terms of currently married, the demographic groups most similar to Immigrants from North America are Scotch-Irish (48.7%, a difference of 0.030%), Belgian (48.7%, a difference of 0.030%), Finnish (48.8%, a difference of 0.040%), Immigrants from Iran (48.7%, a difference of 0.060%), and Northern European (48.7%, a difference of 0.060%).
| Demographics | Rating | Rank | Currently Married |
| Hungarians | 99.4 /100 | #37 | Exceptional 48.8% |
| Czechoslovakians | 99.4 /100 | #38 | Exceptional 48.8% |
| British | 99.4 /100 | #39 | Exceptional 48.8% |
| Immigrants | Canada | 99.4 /100 | #40 | Exceptional 48.8% |
| Greeks | 99.3 /100 | #41 | Exceptional 48.8% |
| Finns | 99.3 /100 | #42 | Exceptional 48.8% |
| Scotch-Irish | 99.3 /100 | #43 | Exceptional 48.7% |
| Immigrants | North America | 99.3 /100 | #44 | Exceptional 48.7% |
| Belgians | 99.3 /100 | #45 | Exceptional 48.7% |
| Immigrants | Iran | 99.2 /100 | #46 | Exceptional 48.7% |
| Northern Europeans | 99.2 /100 | #47 | Exceptional 48.7% |
| Austrians | 99.2 /100 | #48 | Exceptional 48.7% |
| Bhutanese | 99.1 /100 | #49 | Exceptional 48.6% |
| Iranians | 99.0 /100 | #50 | Exceptional 48.6% |
| Whites/Caucasians | 99.0 /100 | #51 | Exceptional 48.6% |