Ethiopian vs Slovene Currently Married
COMPARE
Ethiopian
Slovene
Currently Married
Currently Married Comparison
Ethiopians
Slovenes
44.5%
CURRENTLY MARRIED
0.7/ 100
METRIC RATING
241st/ 347
METRIC RANK
48.1%
CURRENTLY MARRIED
97.1/ 100
METRIC RATING
77th/ 347
METRIC RANK
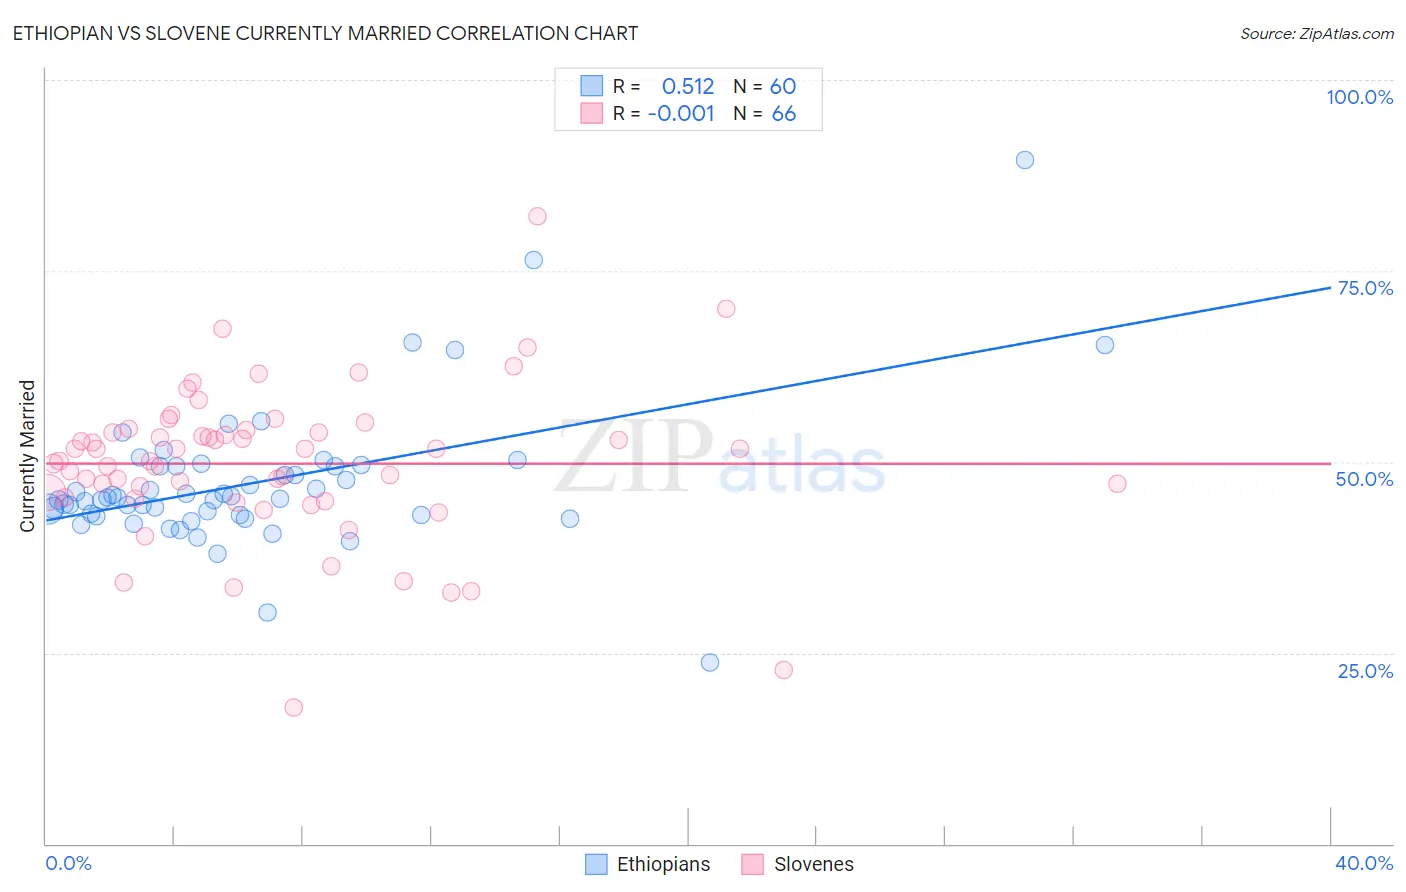
Ethiopian vs Slovene Currently Married Correlation Chart
The statistical analysis conducted on geographies consisting of 223,255,094 people shows a substantial positive correlation between the proportion of Ethiopians and percentage of population currently married in the United States with a correlation coefficient (R) of 0.512 and weighted average of 44.5%. Similarly, the statistical analysis conducted on geographies consisting of 261,329,458 people shows no correlation between the proportion of Slovenes and percentage of population currently married in the United States with a correlation coefficient (R) of -0.001 and weighted average of 48.1%, a difference of 8.1%.
Currently Married Correlation Summary
| Measurement | Ethiopian | Slovene |
| Minimum | 23.8% | 17.9% |
| Maximum | 89.5% | 82.2% |
| Range | 65.7% | 64.3% |
| Mean | 47.3% | 49.8% |
| Median | 45.2% | 50.9% |
| Interquartile 25% (IQ1) | 43.0% | 45.4% |
| Interquartile 75% (IQ3) | 49.4% | 53.8% |
| Interquartile Range (IQR) | 6.3% | 8.5% |
| Standard Deviation (Sample) | 9.5% | 10.2% |
| Standard Deviation (Population) | 9.4% | 10.1% |
Similar Demographics by Currently Married
Demographics Similar to Ethiopians by Currently Married
In terms of currently married, the demographic groups most similar to Ethiopians are Immigrants from Cambodia (44.5%, a difference of 0.030%), Immigrants from Ethiopia (44.5%, a difference of 0.040%), Immigrants from Mexico (44.5%, a difference of 0.060%), Mexican American Indian (44.5%, a difference of 0.060%), and Japanese (44.5%, a difference of 0.12%).
| Demographics | Rating | Rank | Currently Married |
| Iroquois | 1.1 /100 | #234 | Tragic 44.7% |
| Alaskan Athabascans | 0.9 /100 | #235 | Tragic 44.6% |
| Cubans | 0.9 /100 | #236 | Tragic 44.6% |
| Seminole | 0.9 /100 | #237 | Tragic 44.6% |
| Moroccans | 0.9 /100 | #238 | Tragic 44.6% |
| Immigrants | Mexico | 0.7 /100 | #239 | Tragic 44.5% |
| Mexican American Indians | 0.7 /100 | #240 | Tragic 44.5% |
| Ethiopians | 0.7 /100 | #241 | Tragic 44.5% |
| Immigrants | Cambodia | 0.7 /100 | #242 | Tragic 44.5% |
| Immigrants | Ethiopia | 0.7 /100 | #243 | Tragic 44.5% |
| Japanese | 0.6 /100 | #244 | Tragic 44.5% |
| Immigrants | Armenia | 0.4 /100 | #245 | Tragic 44.3% |
| Immigrants | Burma/Myanmar | 0.4 /100 | #246 | Tragic 44.3% |
| Ugandans | 0.4 /100 | #247 | Tragic 44.2% |
| Nicaraguans | 0.3 /100 | #248 | Tragic 44.2% |
Demographics Similar to Slovenes by Currently Married
In terms of currently married, the demographic groups most similar to Slovenes are Immigrants from Belgium (48.1%, a difference of 0.010%), Basque (48.1%, a difference of 0.020%), Immigrants from South Africa (48.1%, a difference of 0.020%), Immigrants from Belarus (48.1%, a difference of 0.050%), and Immigrants from Poland (48.1%, a difference of 0.050%).
| Demographics | Rating | Rank | Currently Married |
| Immigrants | Asia | 97.9 /100 | #70 | Exceptional 48.3% |
| Macedonians | 97.9 /100 | #71 | Exceptional 48.3% |
| Immigrants | Lebanon | 97.6 /100 | #72 | Exceptional 48.2% |
| Immigrants | Eastern Asia | 97.5 /100 | #73 | Exceptional 48.2% |
| Estonians | 97.4 /100 | #74 | Exceptional 48.2% |
| Immigrants | Belarus | 97.2 /100 | #75 | Exceptional 48.1% |
| Basques | 97.2 /100 | #76 | Exceptional 48.1% |
| Slovenes | 97.1 /100 | #77 | Exceptional 48.1% |
| Immigrants | Belgium | 97.1 /100 | #78 | Exceptional 48.1% |
| Immigrants | South Africa | 97.0 /100 | #79 | Exceptional 48.1% |
| Immigrants | Poland | 96.9 /100 | #80 | Exceptional 48.1% |
| Immigrants | Sri Lanka | 96.9 /100 | #81 | Exceptional 48.1% |
| Immigrants | Europe | 96.9 /100 | #82 | Exceptional 48.1% |
| Bolivians | 96.9 /100 | #83 | Exceptional 48.1% |
| Immigrants | Israel | 96.9 /100 | #84 | Exceptional 48.1% |